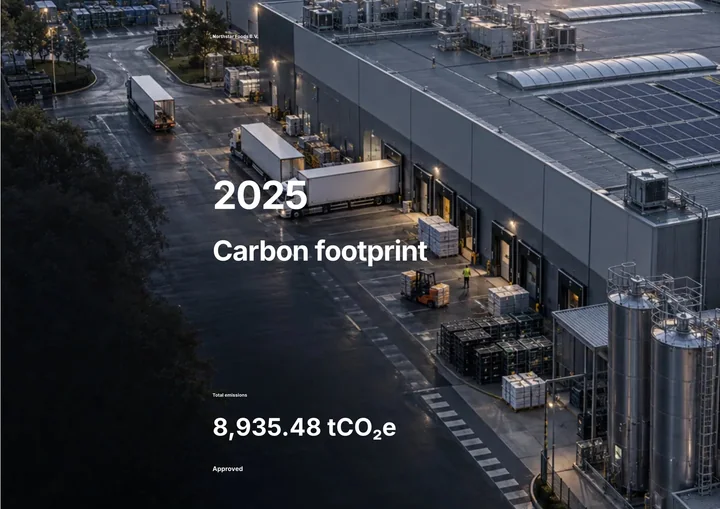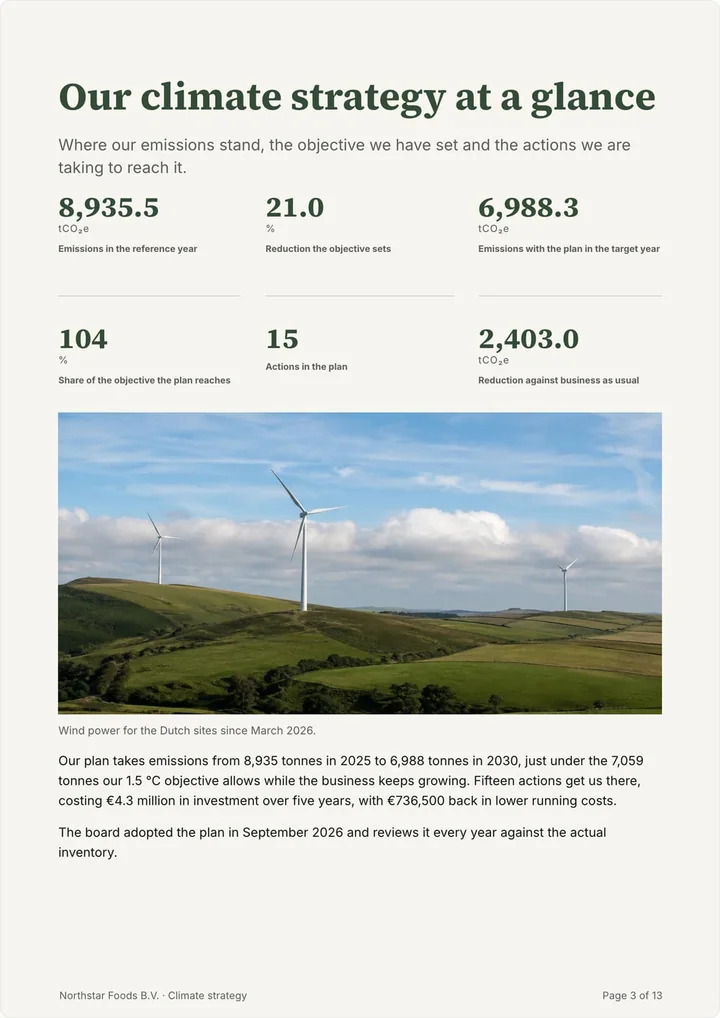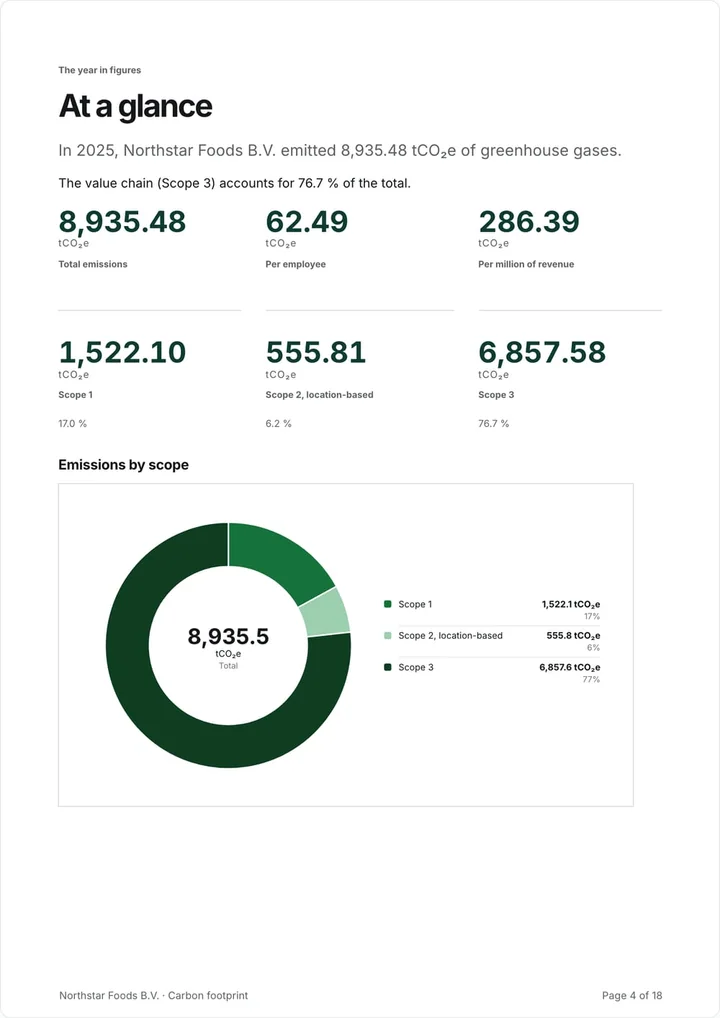
Set the boundary and year, collect your energy, fuel and purchase records, multiply each activity by a published emission factor and add the results per scope. Start with Scope 1 and 2, then estimate the largest Scope 3 sources and improve them year by year. Keep the factor and its source beside every figure.
What a company carbon footprint is
A company carbon footprint is the total greenhouse gas emissions caused by your business over one year, expressed in tonnes of CO₂ equivalent (tCO₂e). Almost everyone uses the GHG Protocol Corporate Standard to calculate it. It splits emissions into three scopes: Scope 1 is what you burn or release yourself, such as gas for heating and diesel in company vehicles. Scope 2 is the electricity and heat you buy. Scope 3 is everything else in your value chain, from purchased goods to business travel and commuting.
Every figure comes from the same simple sum: an activity amount multiplied by an emission factor. 10,000 litres of diesel times a factor in kilograms of CO₂e per litre gives kilograms of CO₂e; divide by 1,000 for tonnes. The work is in finding the right activity amounts and the right factors, and in keeping both traceable.
Step 1: set the boundary and the year
Decide which legal entities and sites are included and which twelve months you report on. Most smaller companies use operational control: you include everything you run day to day. Use the same entities and financial year as your annual accounts, so a bank or customer can compare the footprint with your revenue and headcount.
Step 2: collect the records you already have
Start with Scope 1 and 2, because the records already exist: gas and electricity bills, fuel cards and the service reports for air conditioning and refrigeration. Then list your Scope 3 sources and start with the ones likely to be largest. For most companies that is what they buy, followed by transport, business travel, commuting and waste.
Where a record is missing, an estimate is better than a gap, as long as you label it. Purchases can be estimated from spend, a missing heating bill from floor area, a flight from its route. Replace estimates with measured figures as your data improves, starting with the biggest ones.
Step 3: choose emission factors and calculate
Use a published emission factor that matches each activity’s country, year and unit, and record its source and edition. Common sources are the UK government’s DESNZ conversion factors, ADEME’s Base Empreinte in France and the residual mix and grid factors for your electricity. For purchased electricity, report a location-based figure from the grid average and, if you have renewable contracts, a market-based figure beside it.
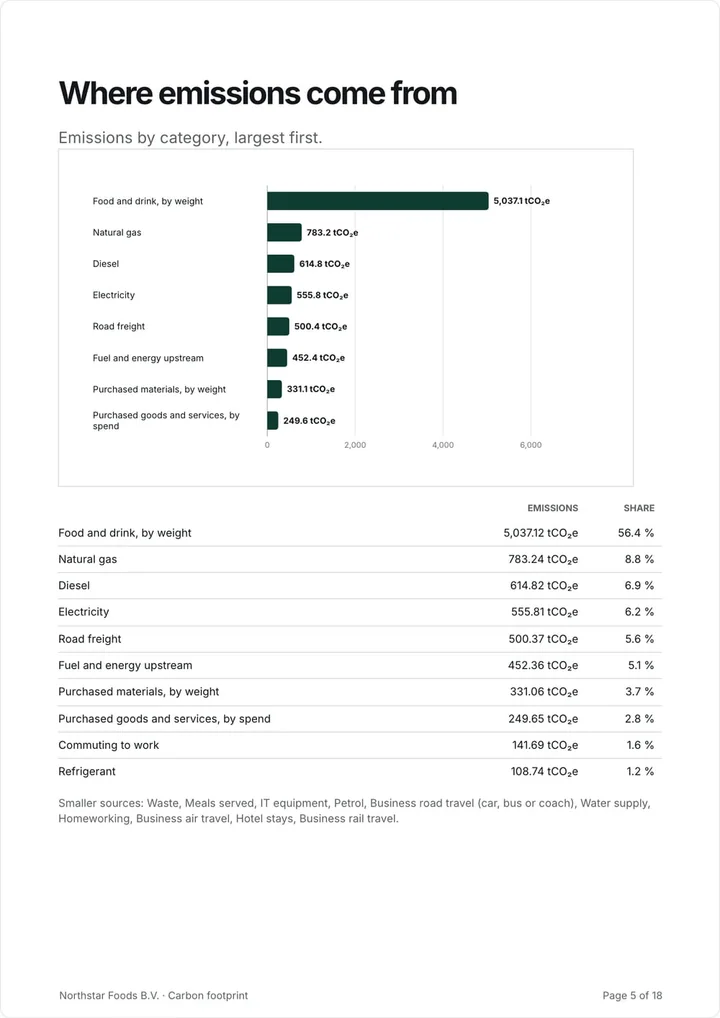
Add up the results per scope and per source, then look at the biggest three. They usually make up most of the footprint and are where reduction, and better data, pays off first.
Doing it in Greener Ahead
Carbon accounting in Greener Ahead gives every emission source a plain list of what to collect, picks the emission factor from 22 published datasets and shows the factor, source and edition behind every tonne. It covers Scope 1, 2 and all 15 Scope 3 categories, compares the result with last year and your sector, and produces a carbon report you can share. It costs €1,495 per year with unlimited users, and you can try it free for 14 days without a card. Check the pricing page for current details.
What to collect for each source
Most of a first footprint comes from records the finance team already keeps. Collect them per site and per month where you can, so gaps and overlaps show up.
| Source | Scope | Records to collect |
|---|---|---|
| Natural gas for heating | 1 | Gas bills or meter readings, in m³ or kWh |
| Company vehicles | 1 | Fuel card statements, in litres per fuel type |
| Refrigerant top-ups | 1 | Service reports for air conditioning and cooling, in kg per gas |
| Purchased electricity | 2 | Electricity bills in kWh, plus any renewable energy contracts |
| District heating | 2 | Heat bills, in kWh or GJ |
| Purchased goods and services | 3 | Purchase ledger by category, in euros or kilograms |
| Transport and freight | 3 | Freight invoices, in tonne-kilometres or euros |
| Business travel | 3 | Travel bookings, in kilometres or by flight route |
| Employee commuting | 3 | A short survey of distance and mode per employee |
| Waste | 3 | Waste invoices, in tonnes per treatment type |
A worked example
Example Bakery, a fictional business with two sites, calculates Scope 1 and 2 for 2025. The factors below are rounded and illustrative only: use the current edition for your own country and year.
| Activity | Amount | Illustrative factor | Result |
|---|---|---|---|
| Natural gas | 20,000 m³ | 2.0 kg CO₂e per m³ | 40.0 tCO₂e |
| Diesel, delivery vans | 10,000 litres | 2.5 kg CO₂e per litre | 25.0 tCO₂e |
| Electricity, location-based | 48,000 kWh | 0.3 kg CO₂e per kWh | 14.4 tCO₂e |
| Total Scope 1 and 2 | 79.4 tCO₂e |
Mistakes that make a footprint fall apart
A reviewer, bank or customer will look for the same handful of problems. Check for them before you share the result.
- Mixing units, such as kWh and MWh, or litres and cubic metres.
- Using a factor from the wrong country, year or method.
- Counting the same energy twice, for example electricity in both Scope 1 and Scope 2.
- Leaving out refrigerant leaks, which can be large for a small amount of gas.
- Presenting spend-based estimates as measured figures.
- Losing track of where a number came from, so nobody can check it next year.
Sources and scope
- GHG Protocol: Corporate Accounting and Reporting Standard
- GHG Protocol: Scope 2 Guidance
- GHG Protocol: Corporate Value Chain (Scope 3) Standard
- UK government: greenhouse gas conversion factors for company reporting
These resources explain a preparation workflow. Check your selected standard and recipient requirements before sharing your report.
 Joost ThissenFounder