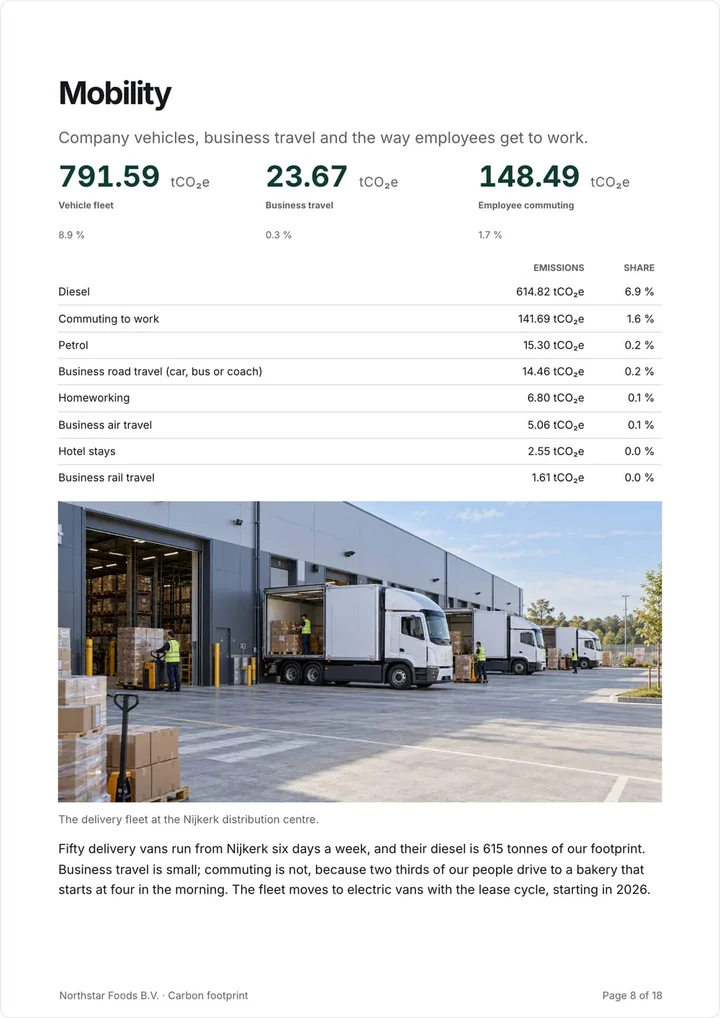
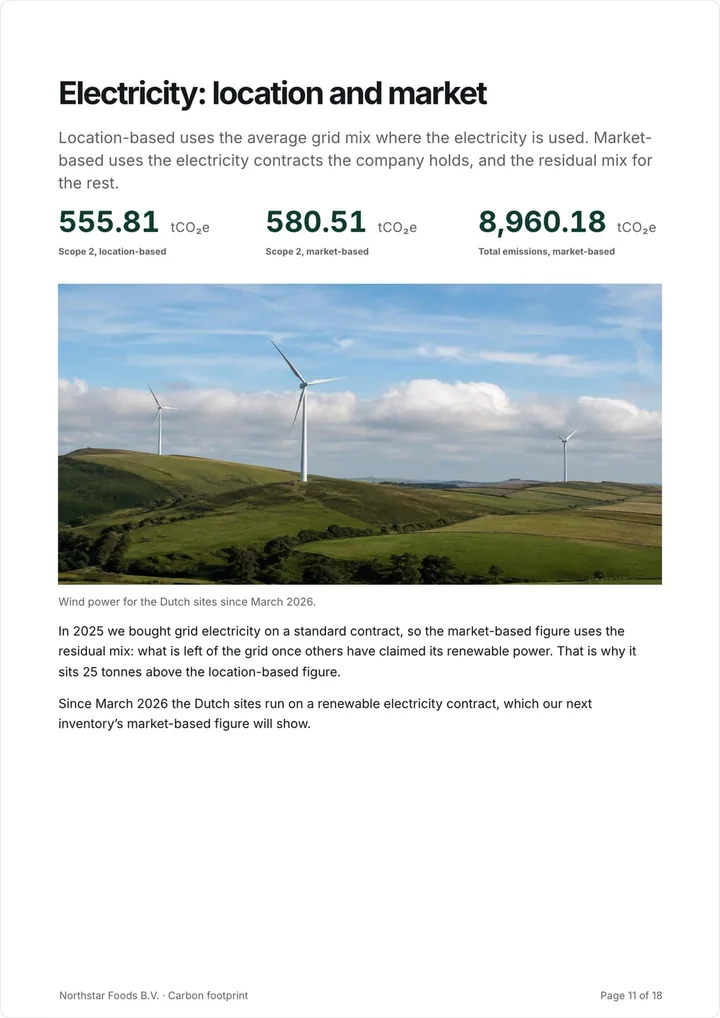
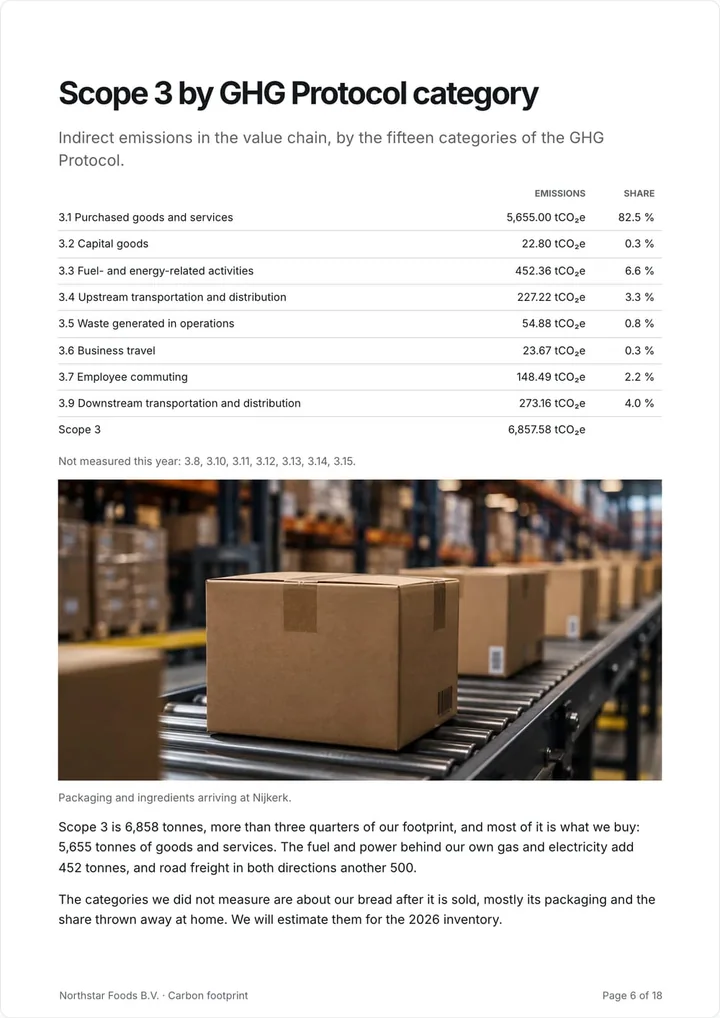
Know exactly what to collect.
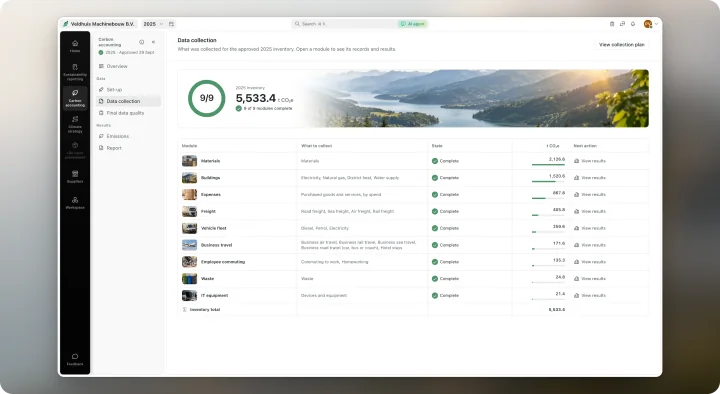
Every emission source comes with a clear list of what to collect, from meter readings and fuel cards to purchase lists and travel bookings.
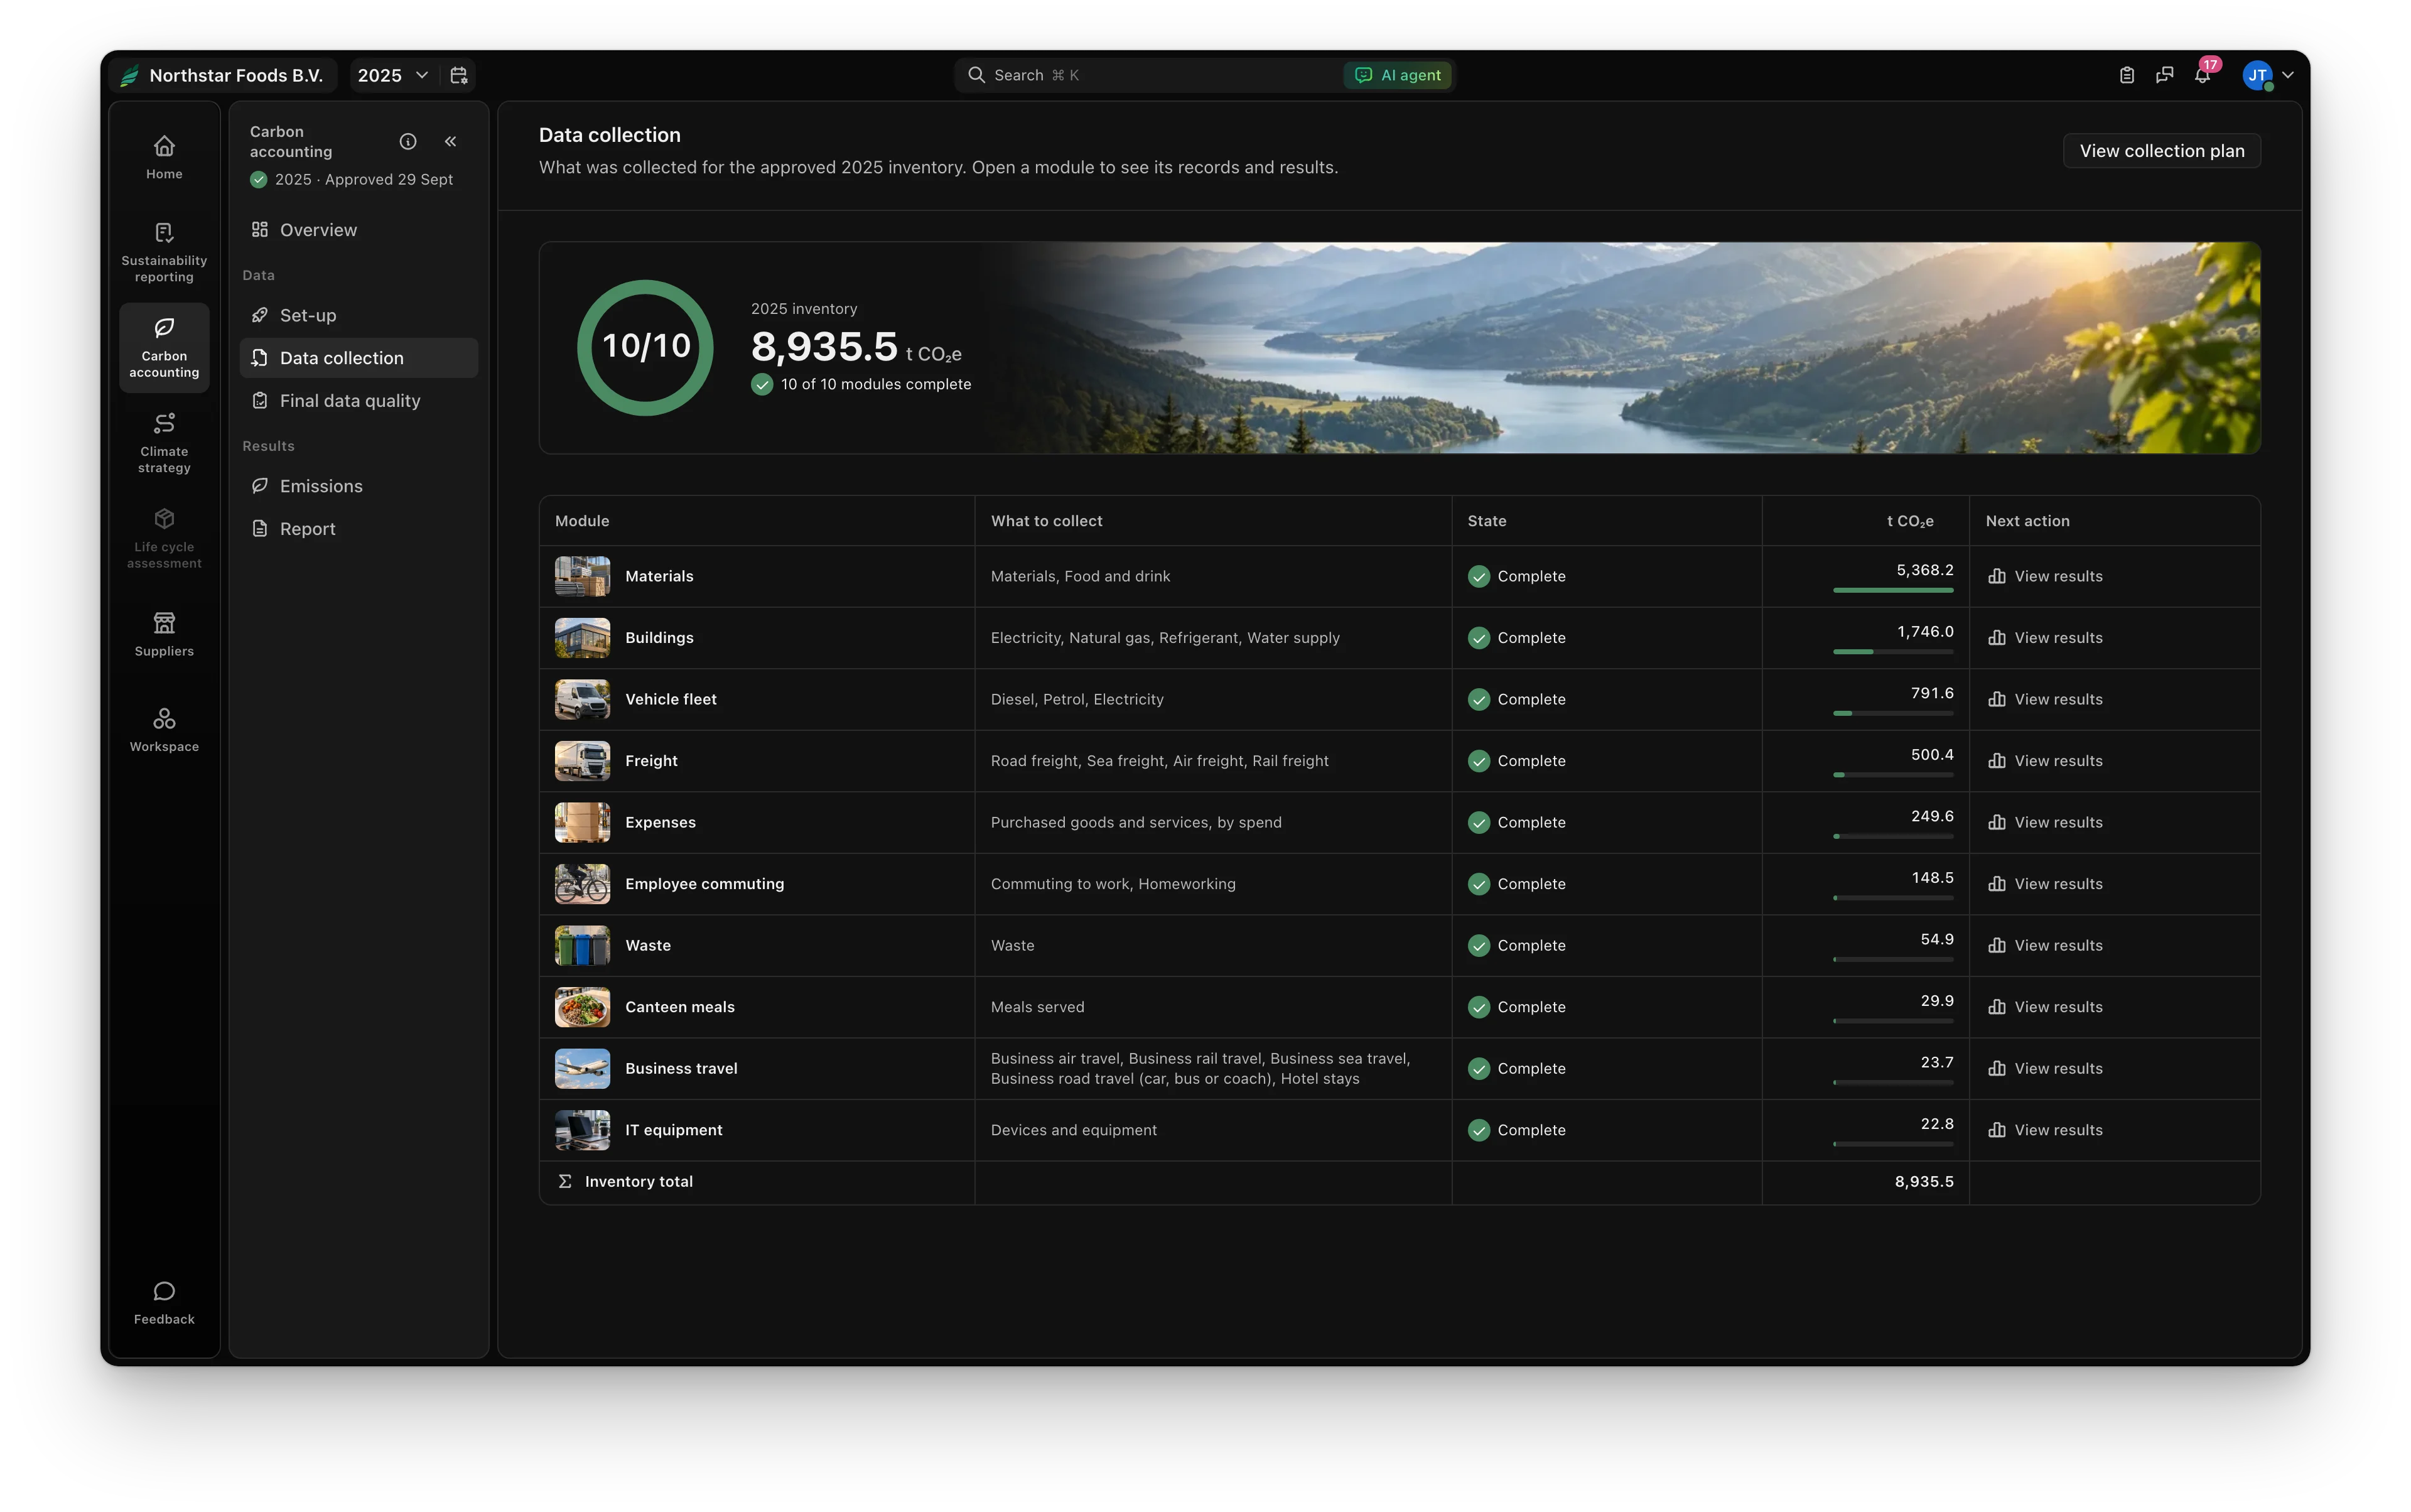
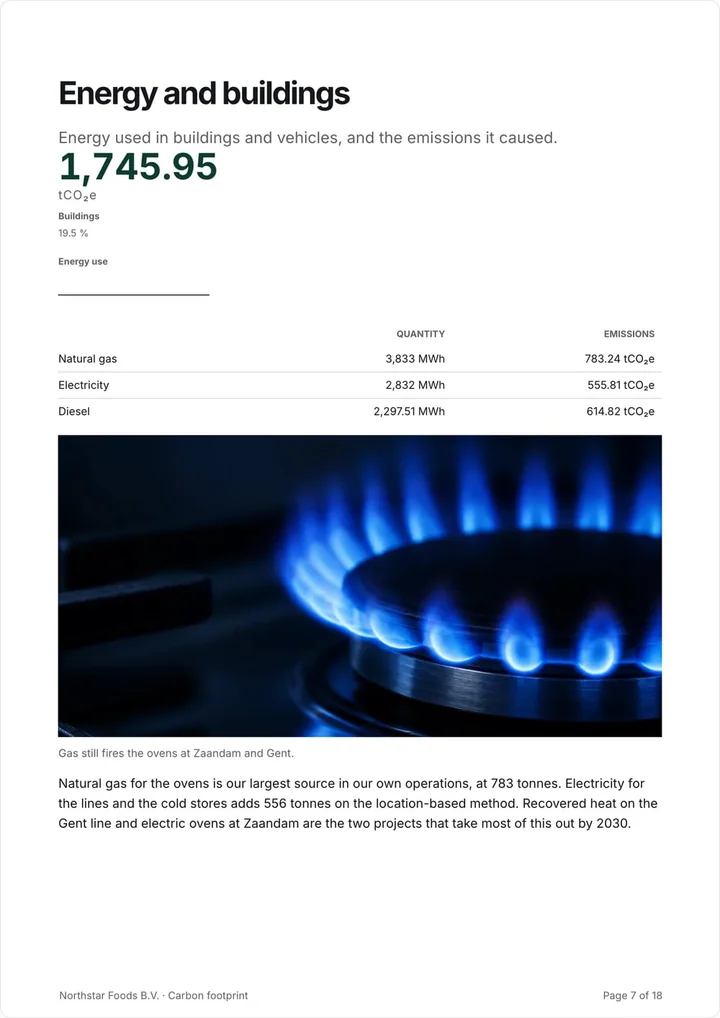
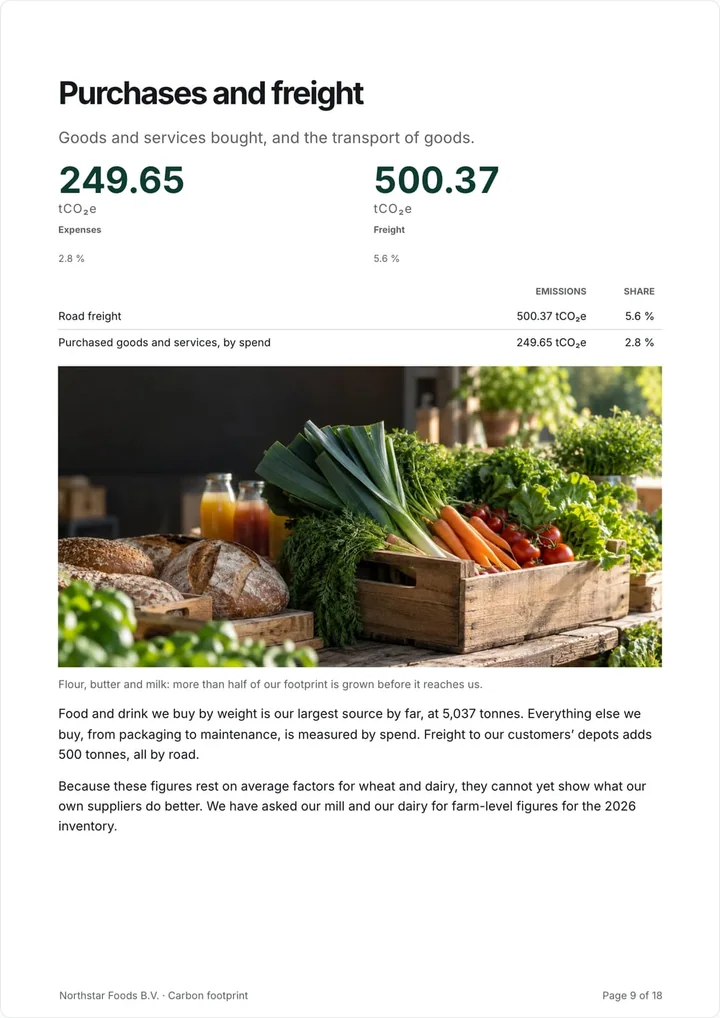
Scope 1, 2 and 3 from your meter readings, fuel cards and invoices, with the emission factor and its source behind every tonne.
Ask anything and get an expert answer instantly, or let it read your documents and do the work.
 Which three sources make up most of our footprint?
Every emission source comes with a clear list of what to collect, from meter readings and fuel cards to purchase lists and travel bookings.
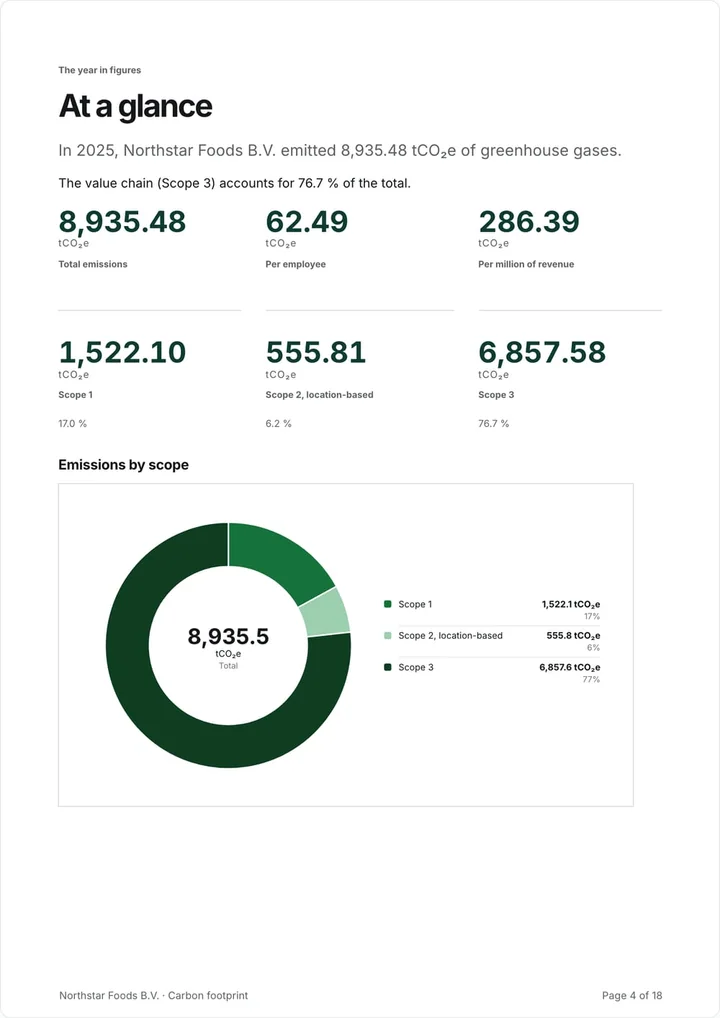
Scope 1, 2 and 3 under the GHG Protocol, compared with last year, broken down by source, with your next step always in view.
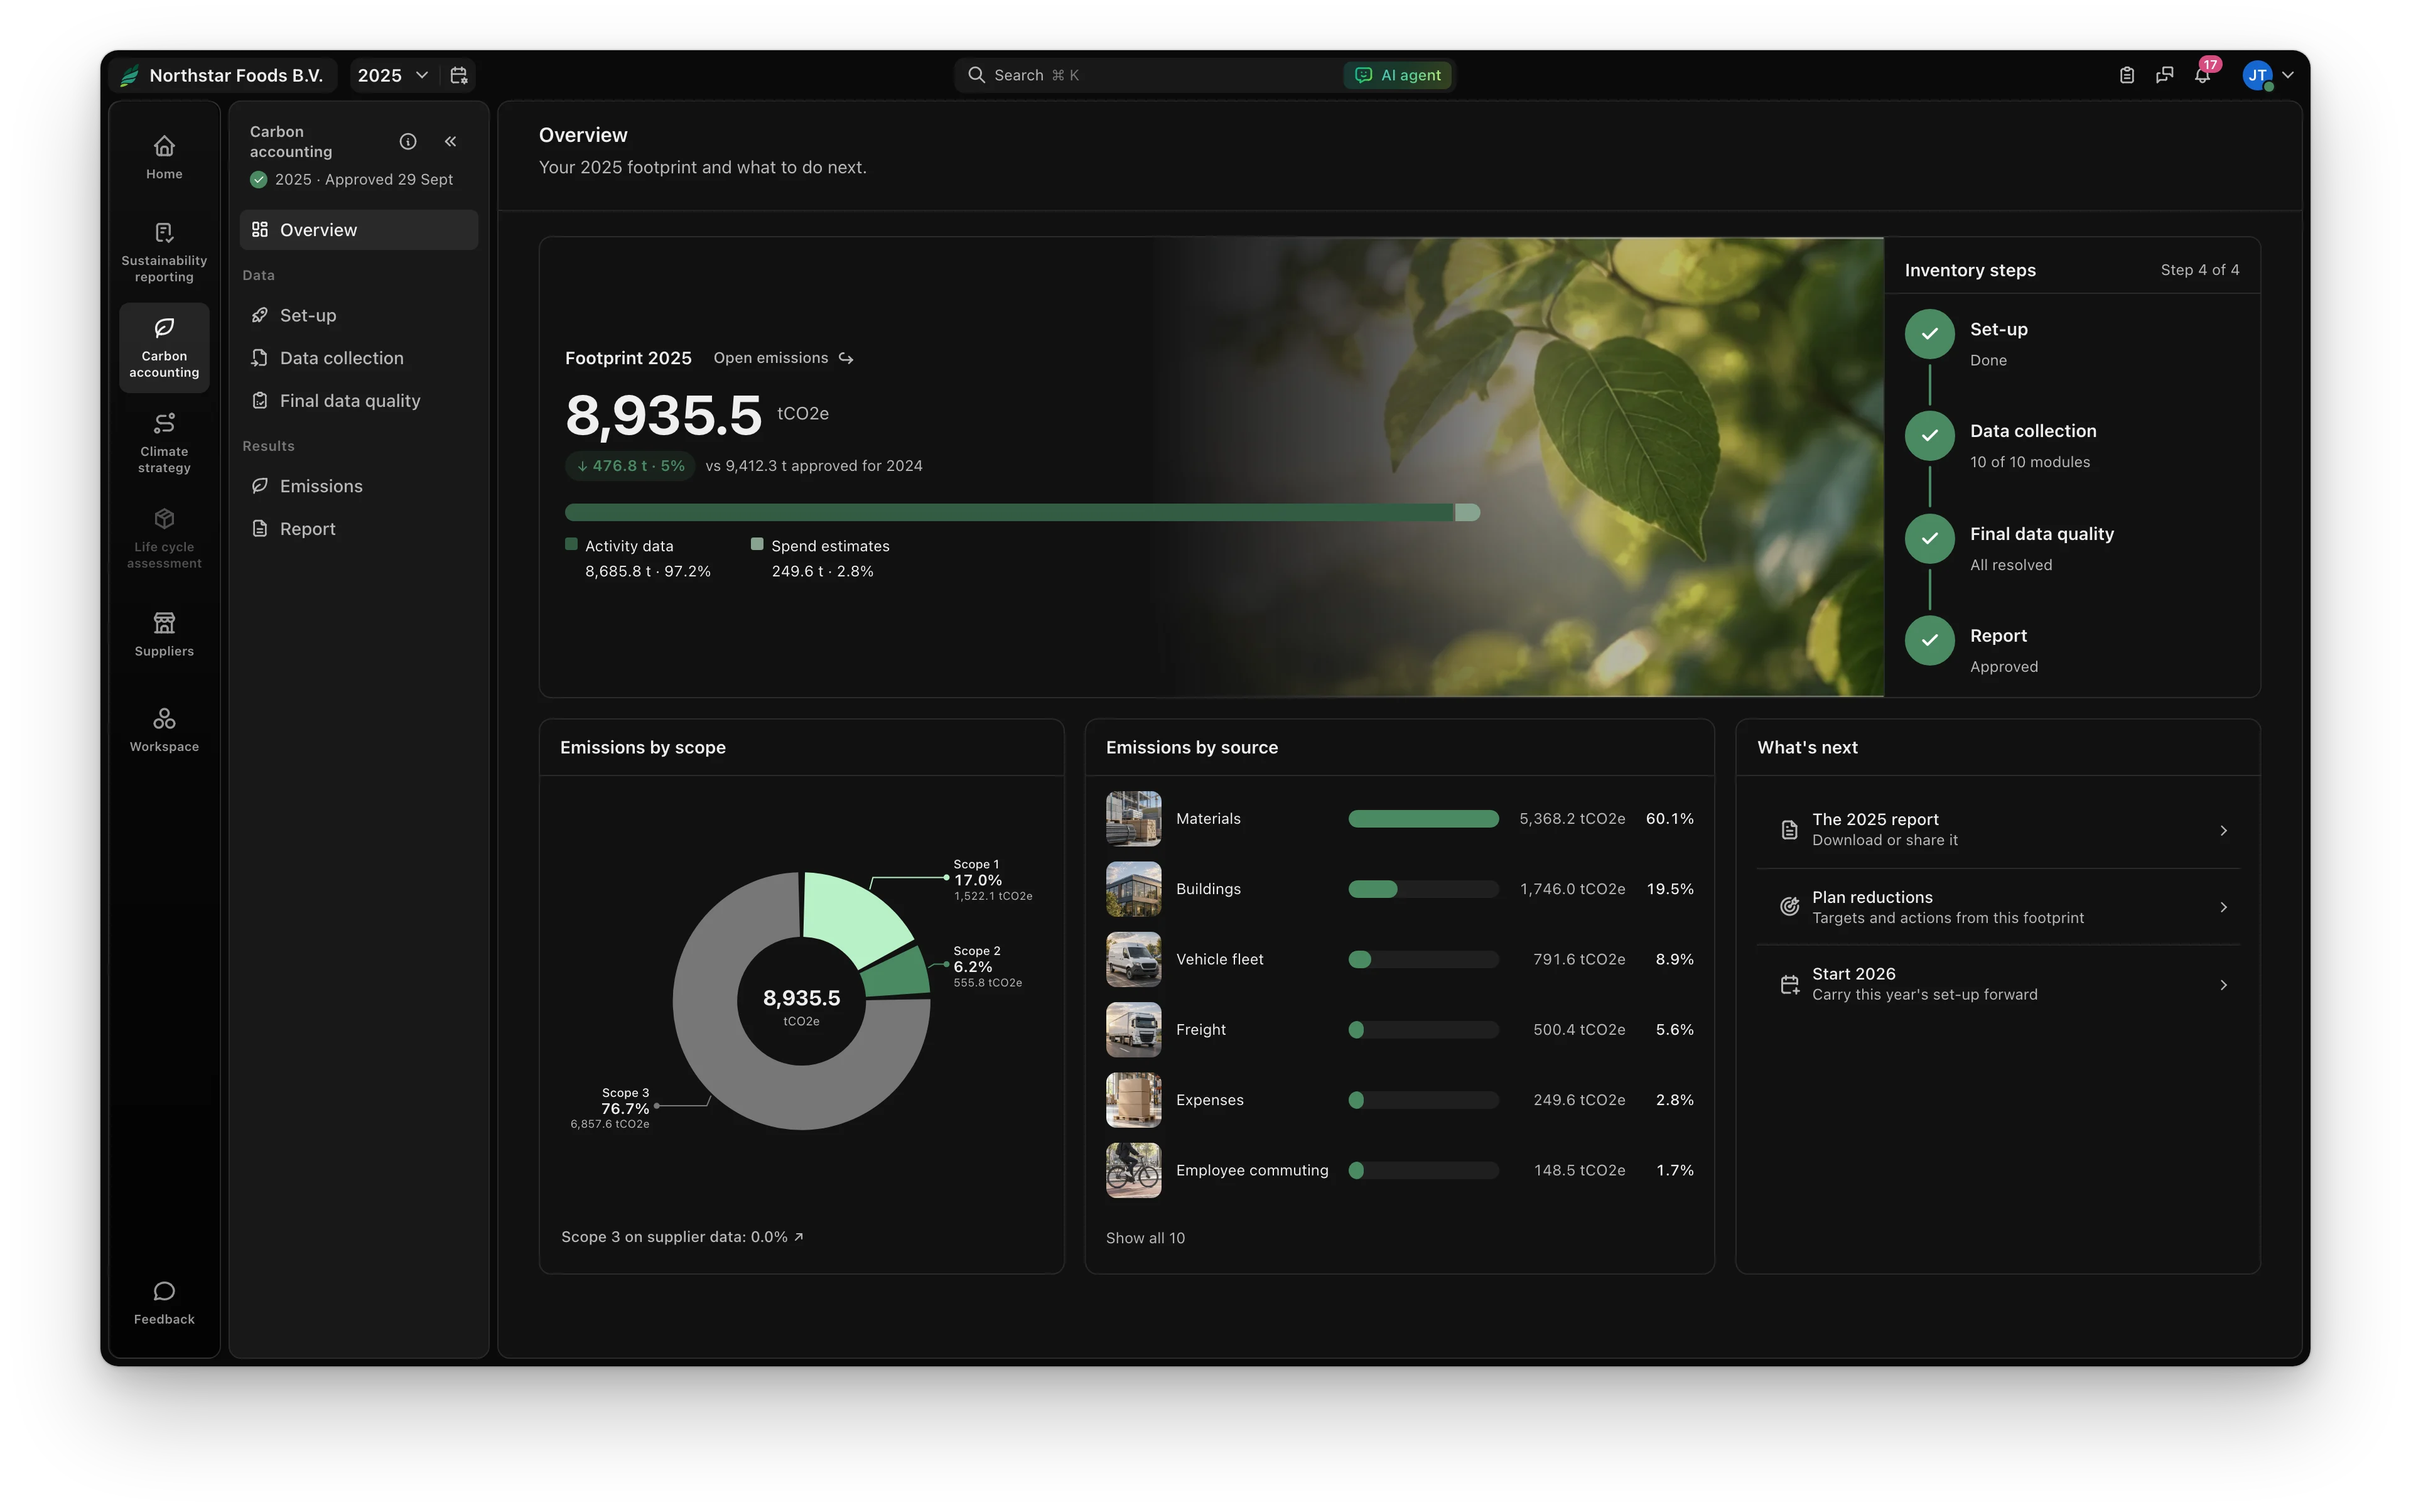
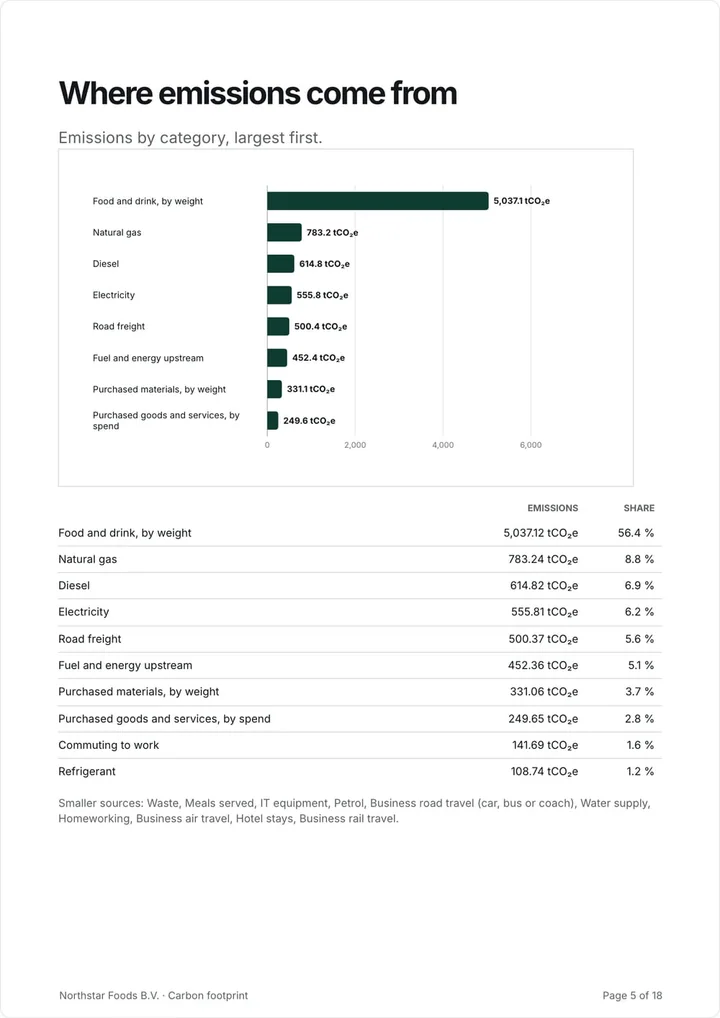
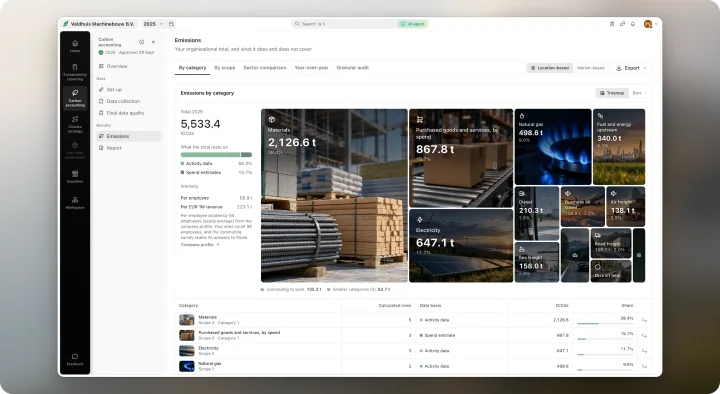
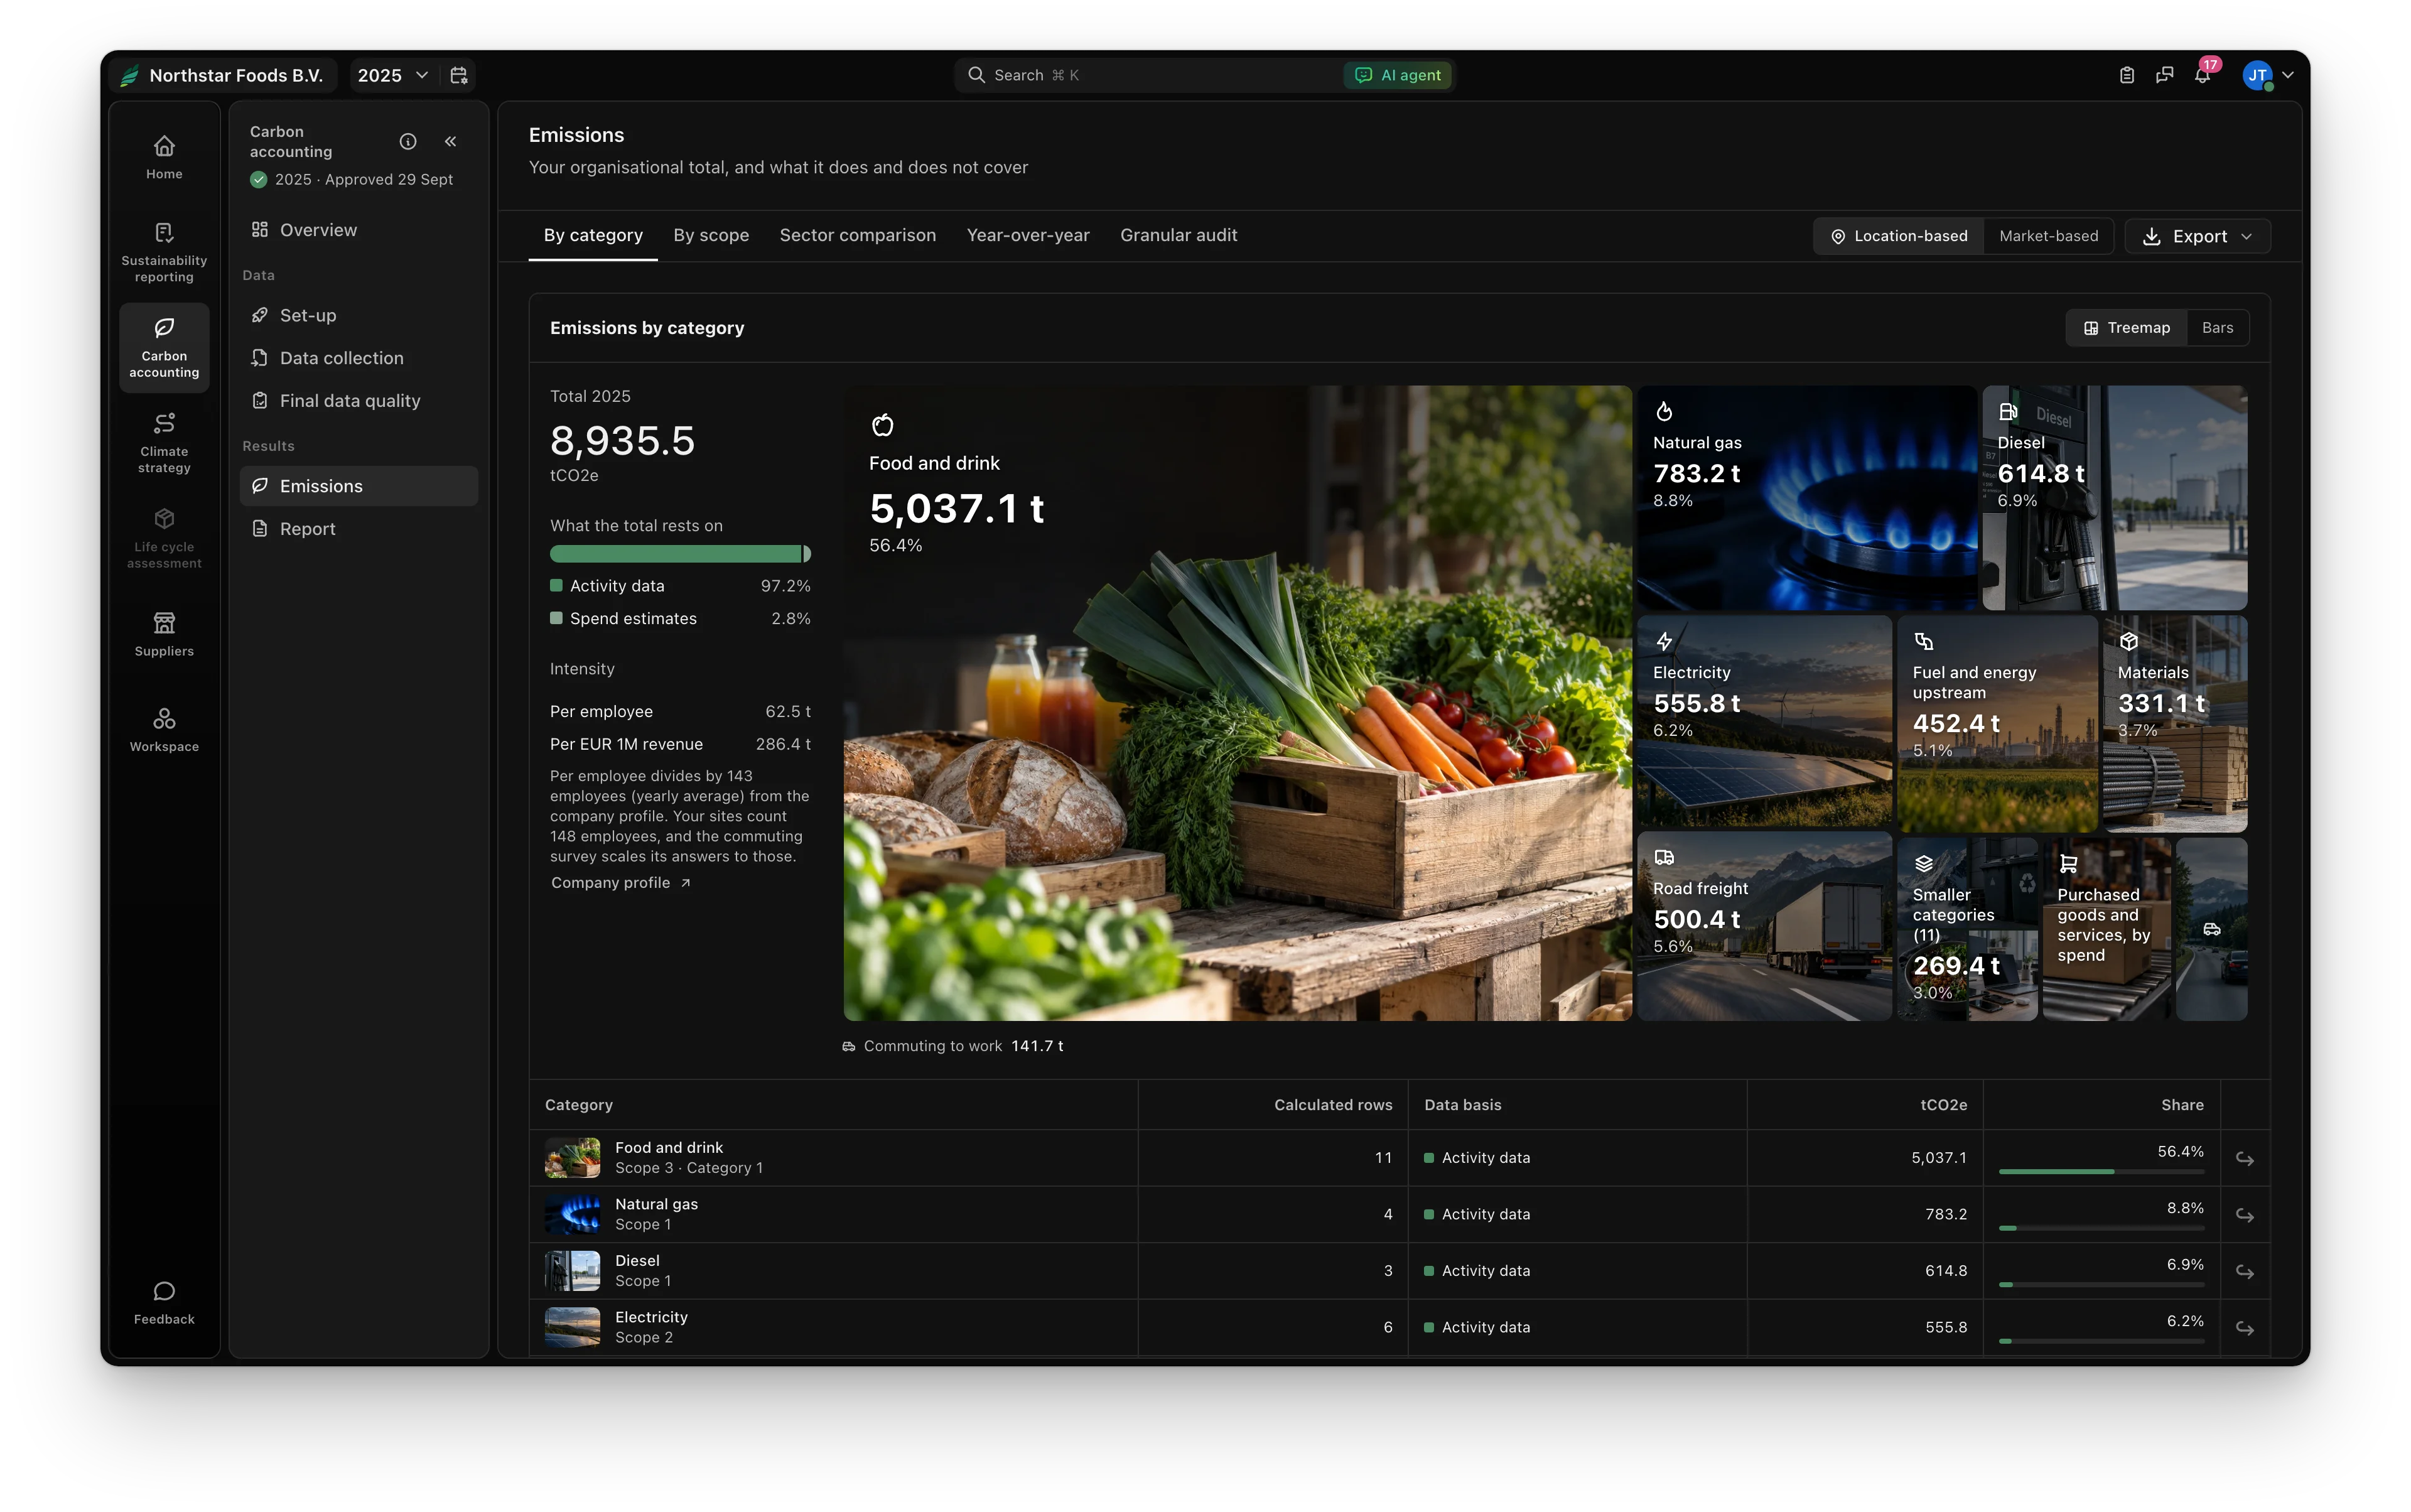
The few categories behind most of your footprint stand out first, so you know where to act. Then compare with your sector or trace every tonne back to its source.
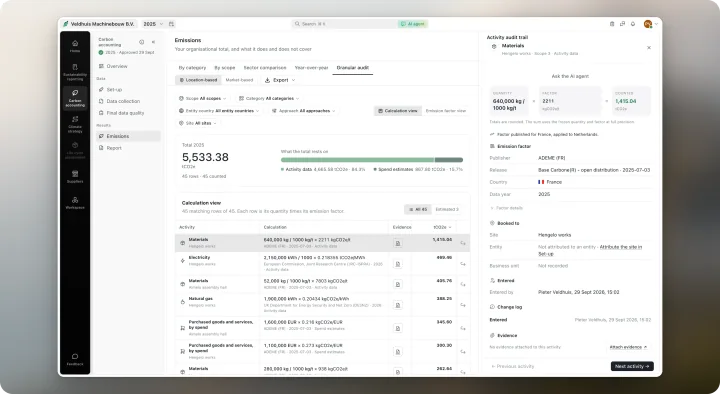
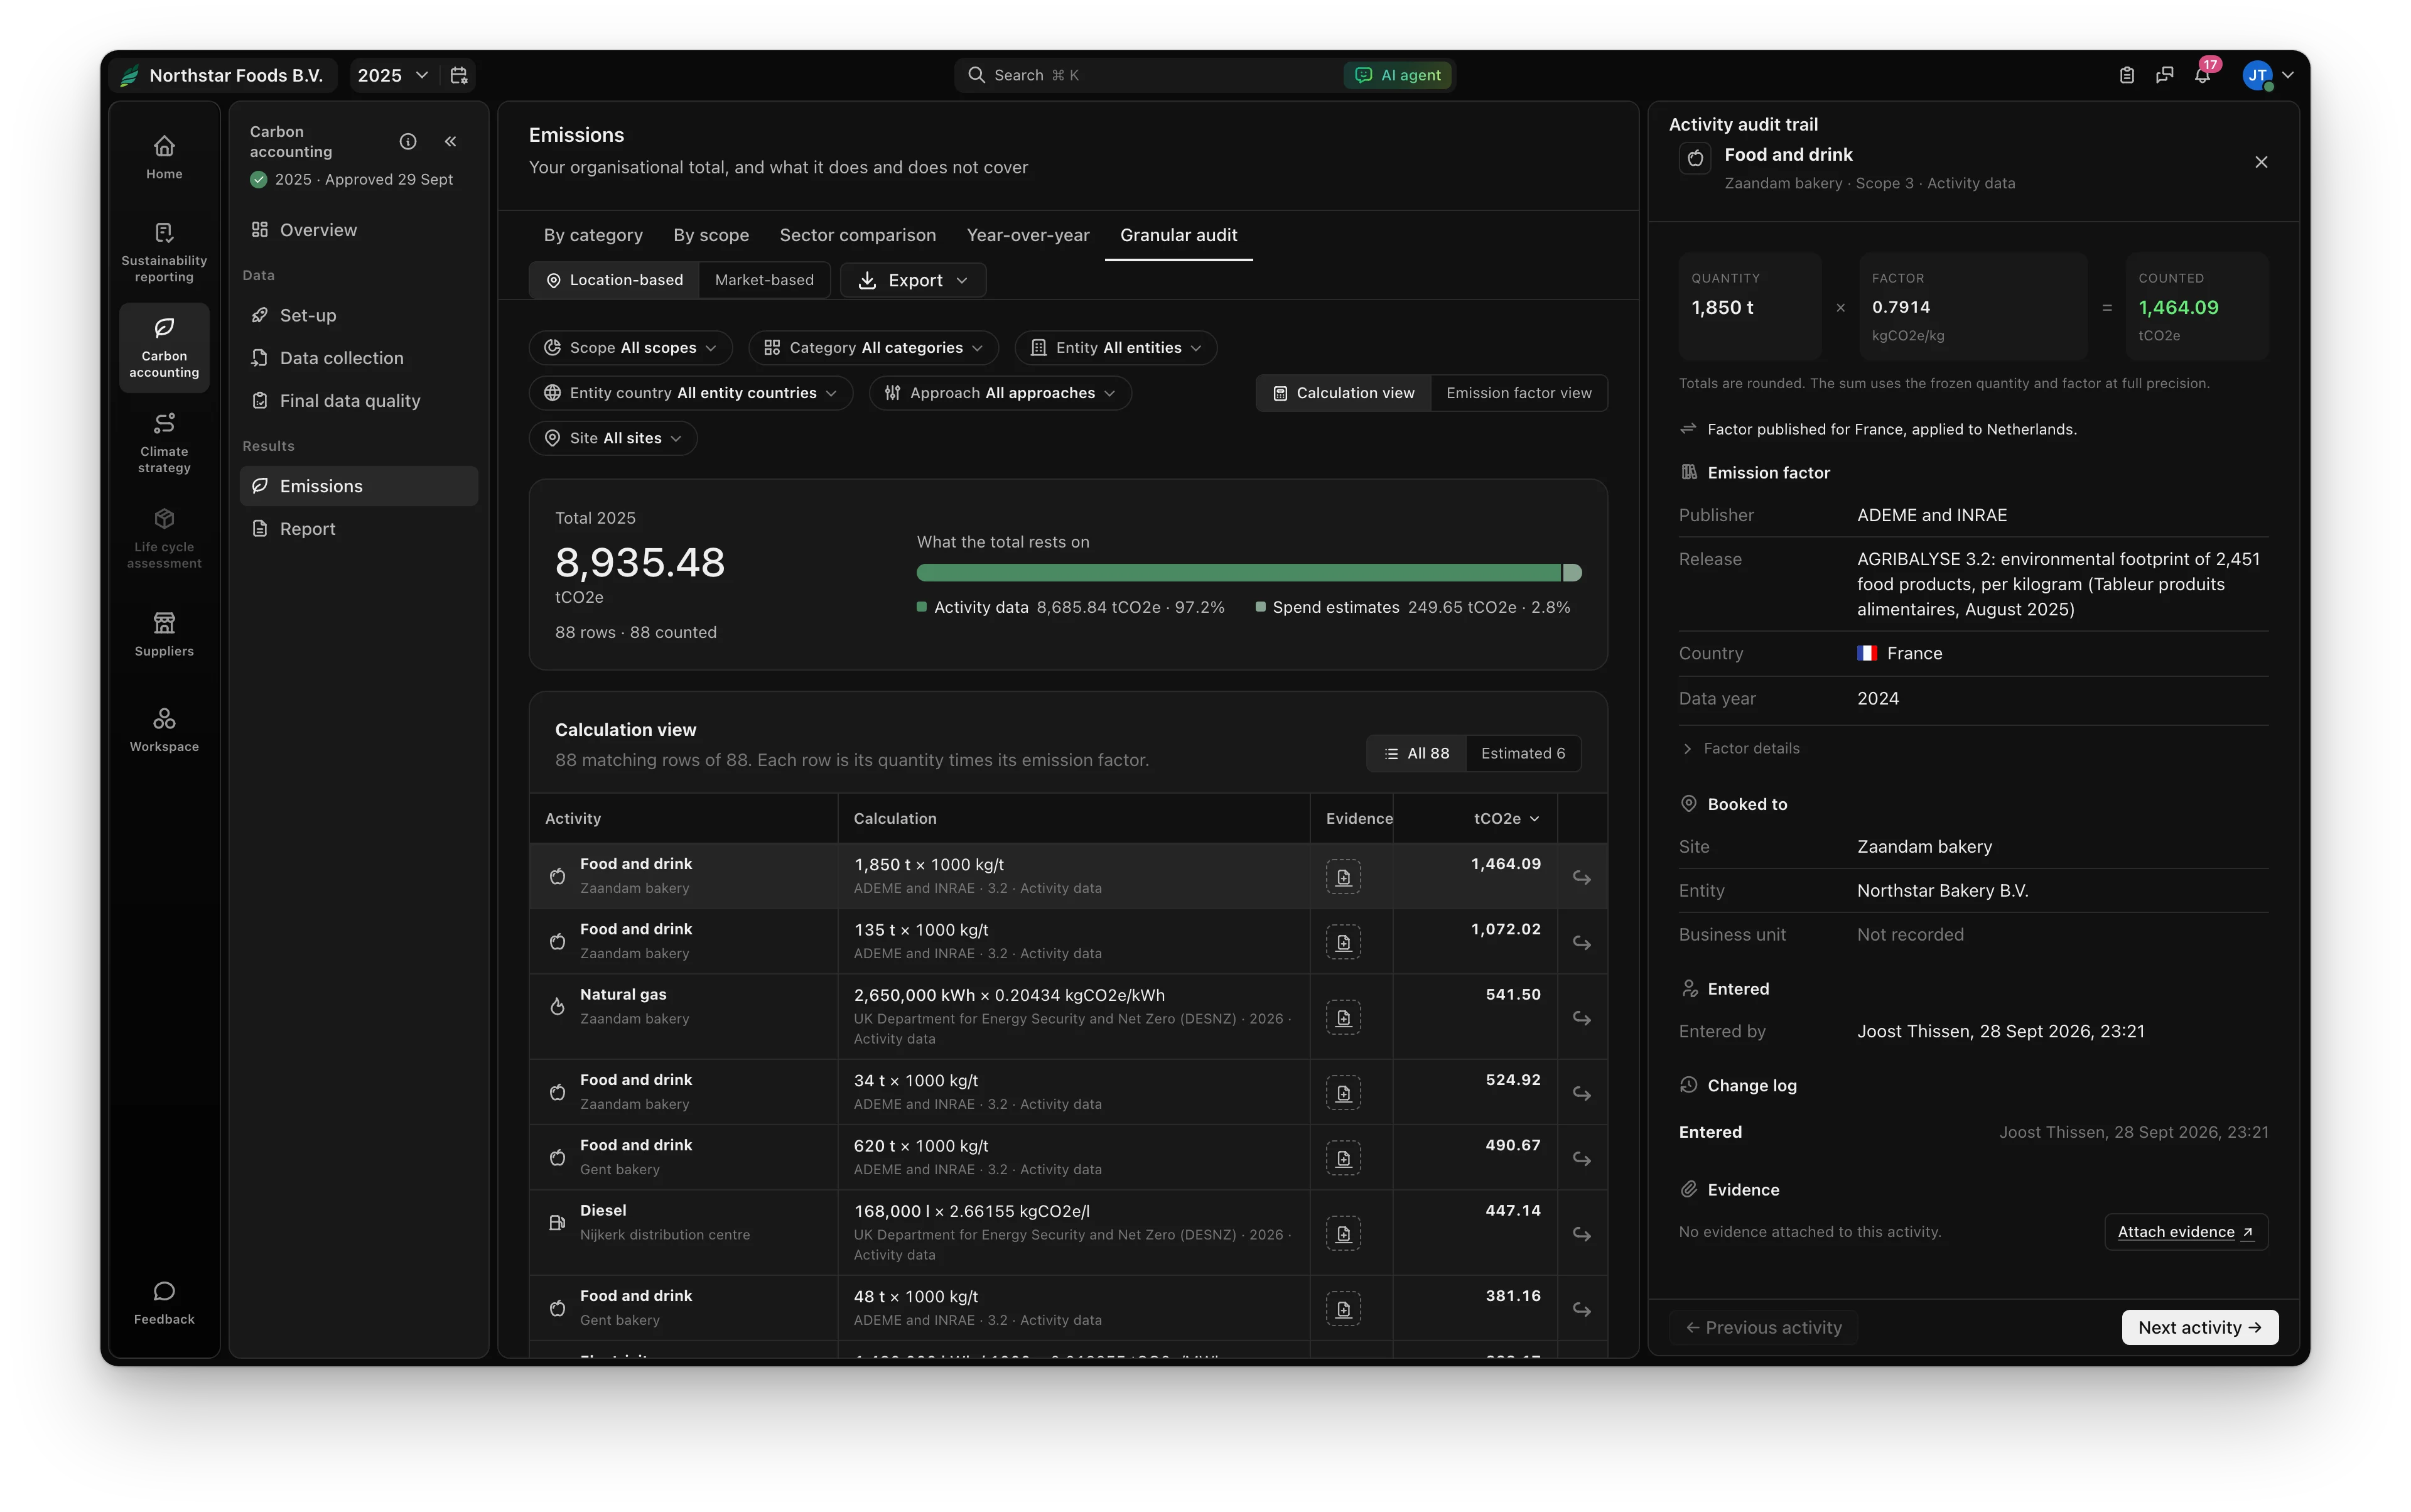
Open any tonne and see the sum behind it, where the emission factor comes from, who entered it and every change since.
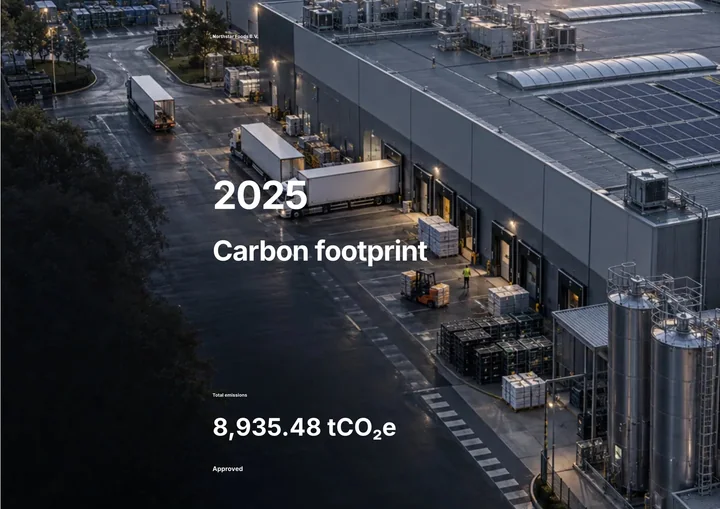
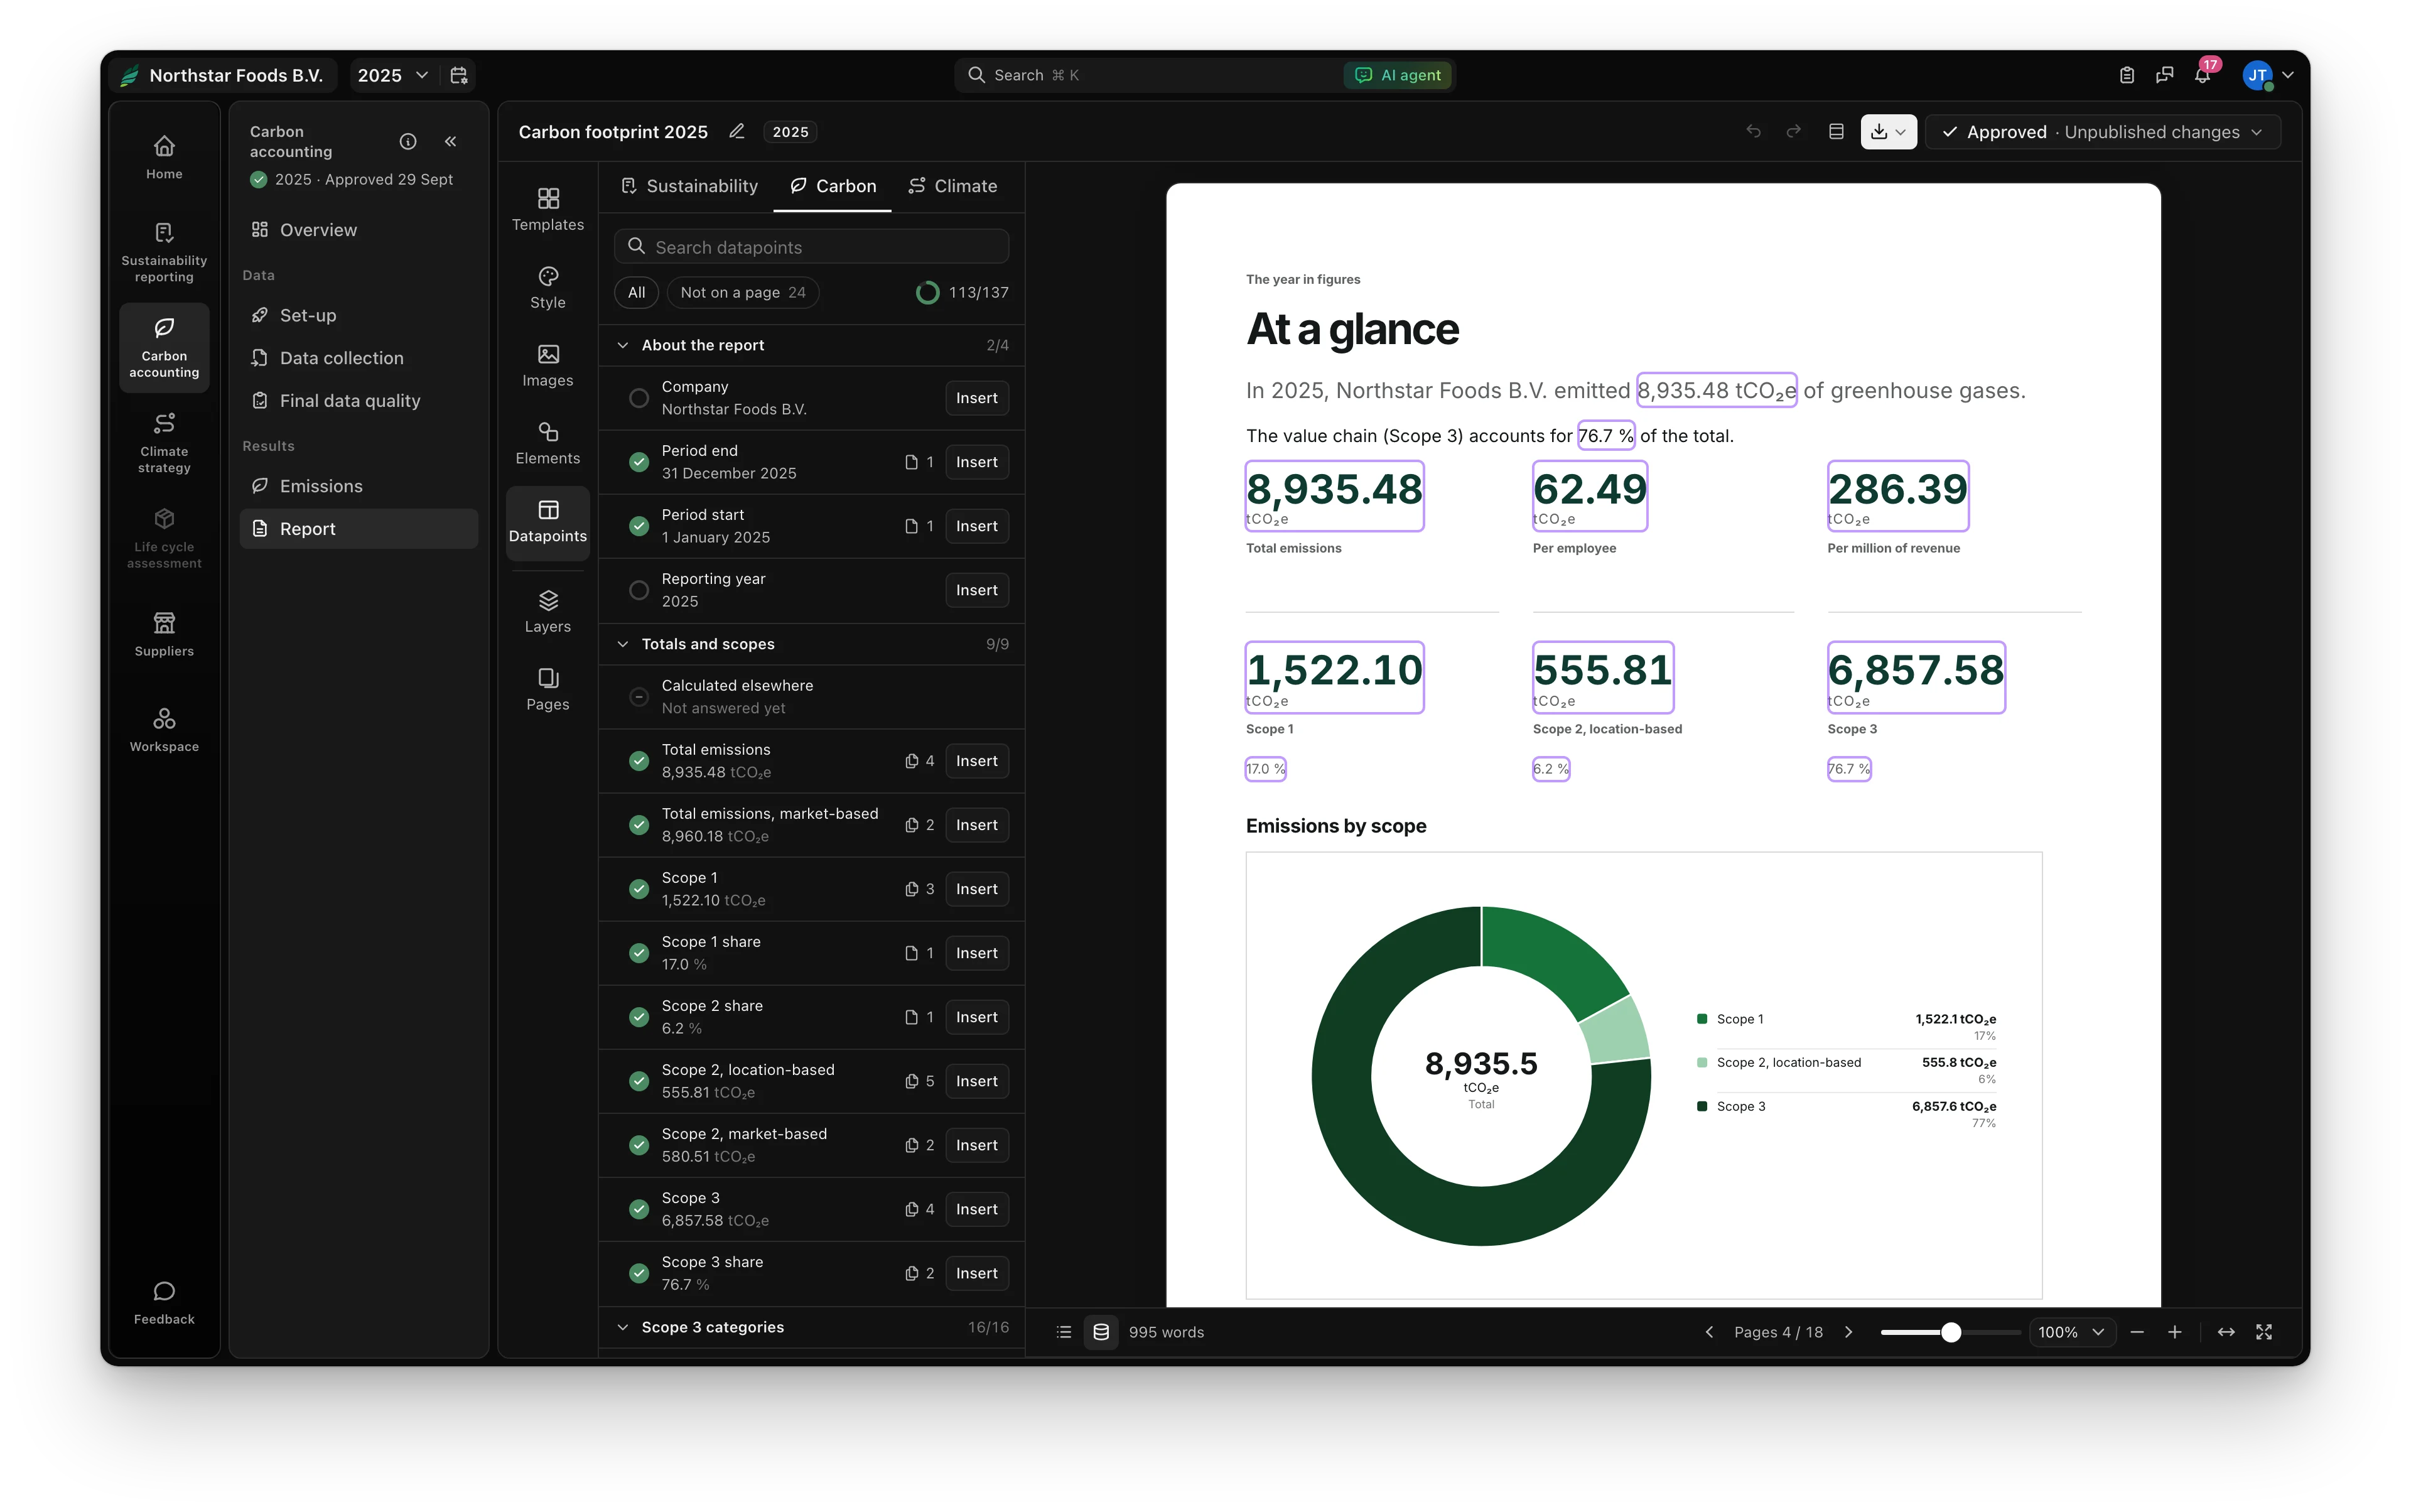
Carbon reports from ready-made templates, with full design freedom. Fast to make, easy to change, compliant by default.
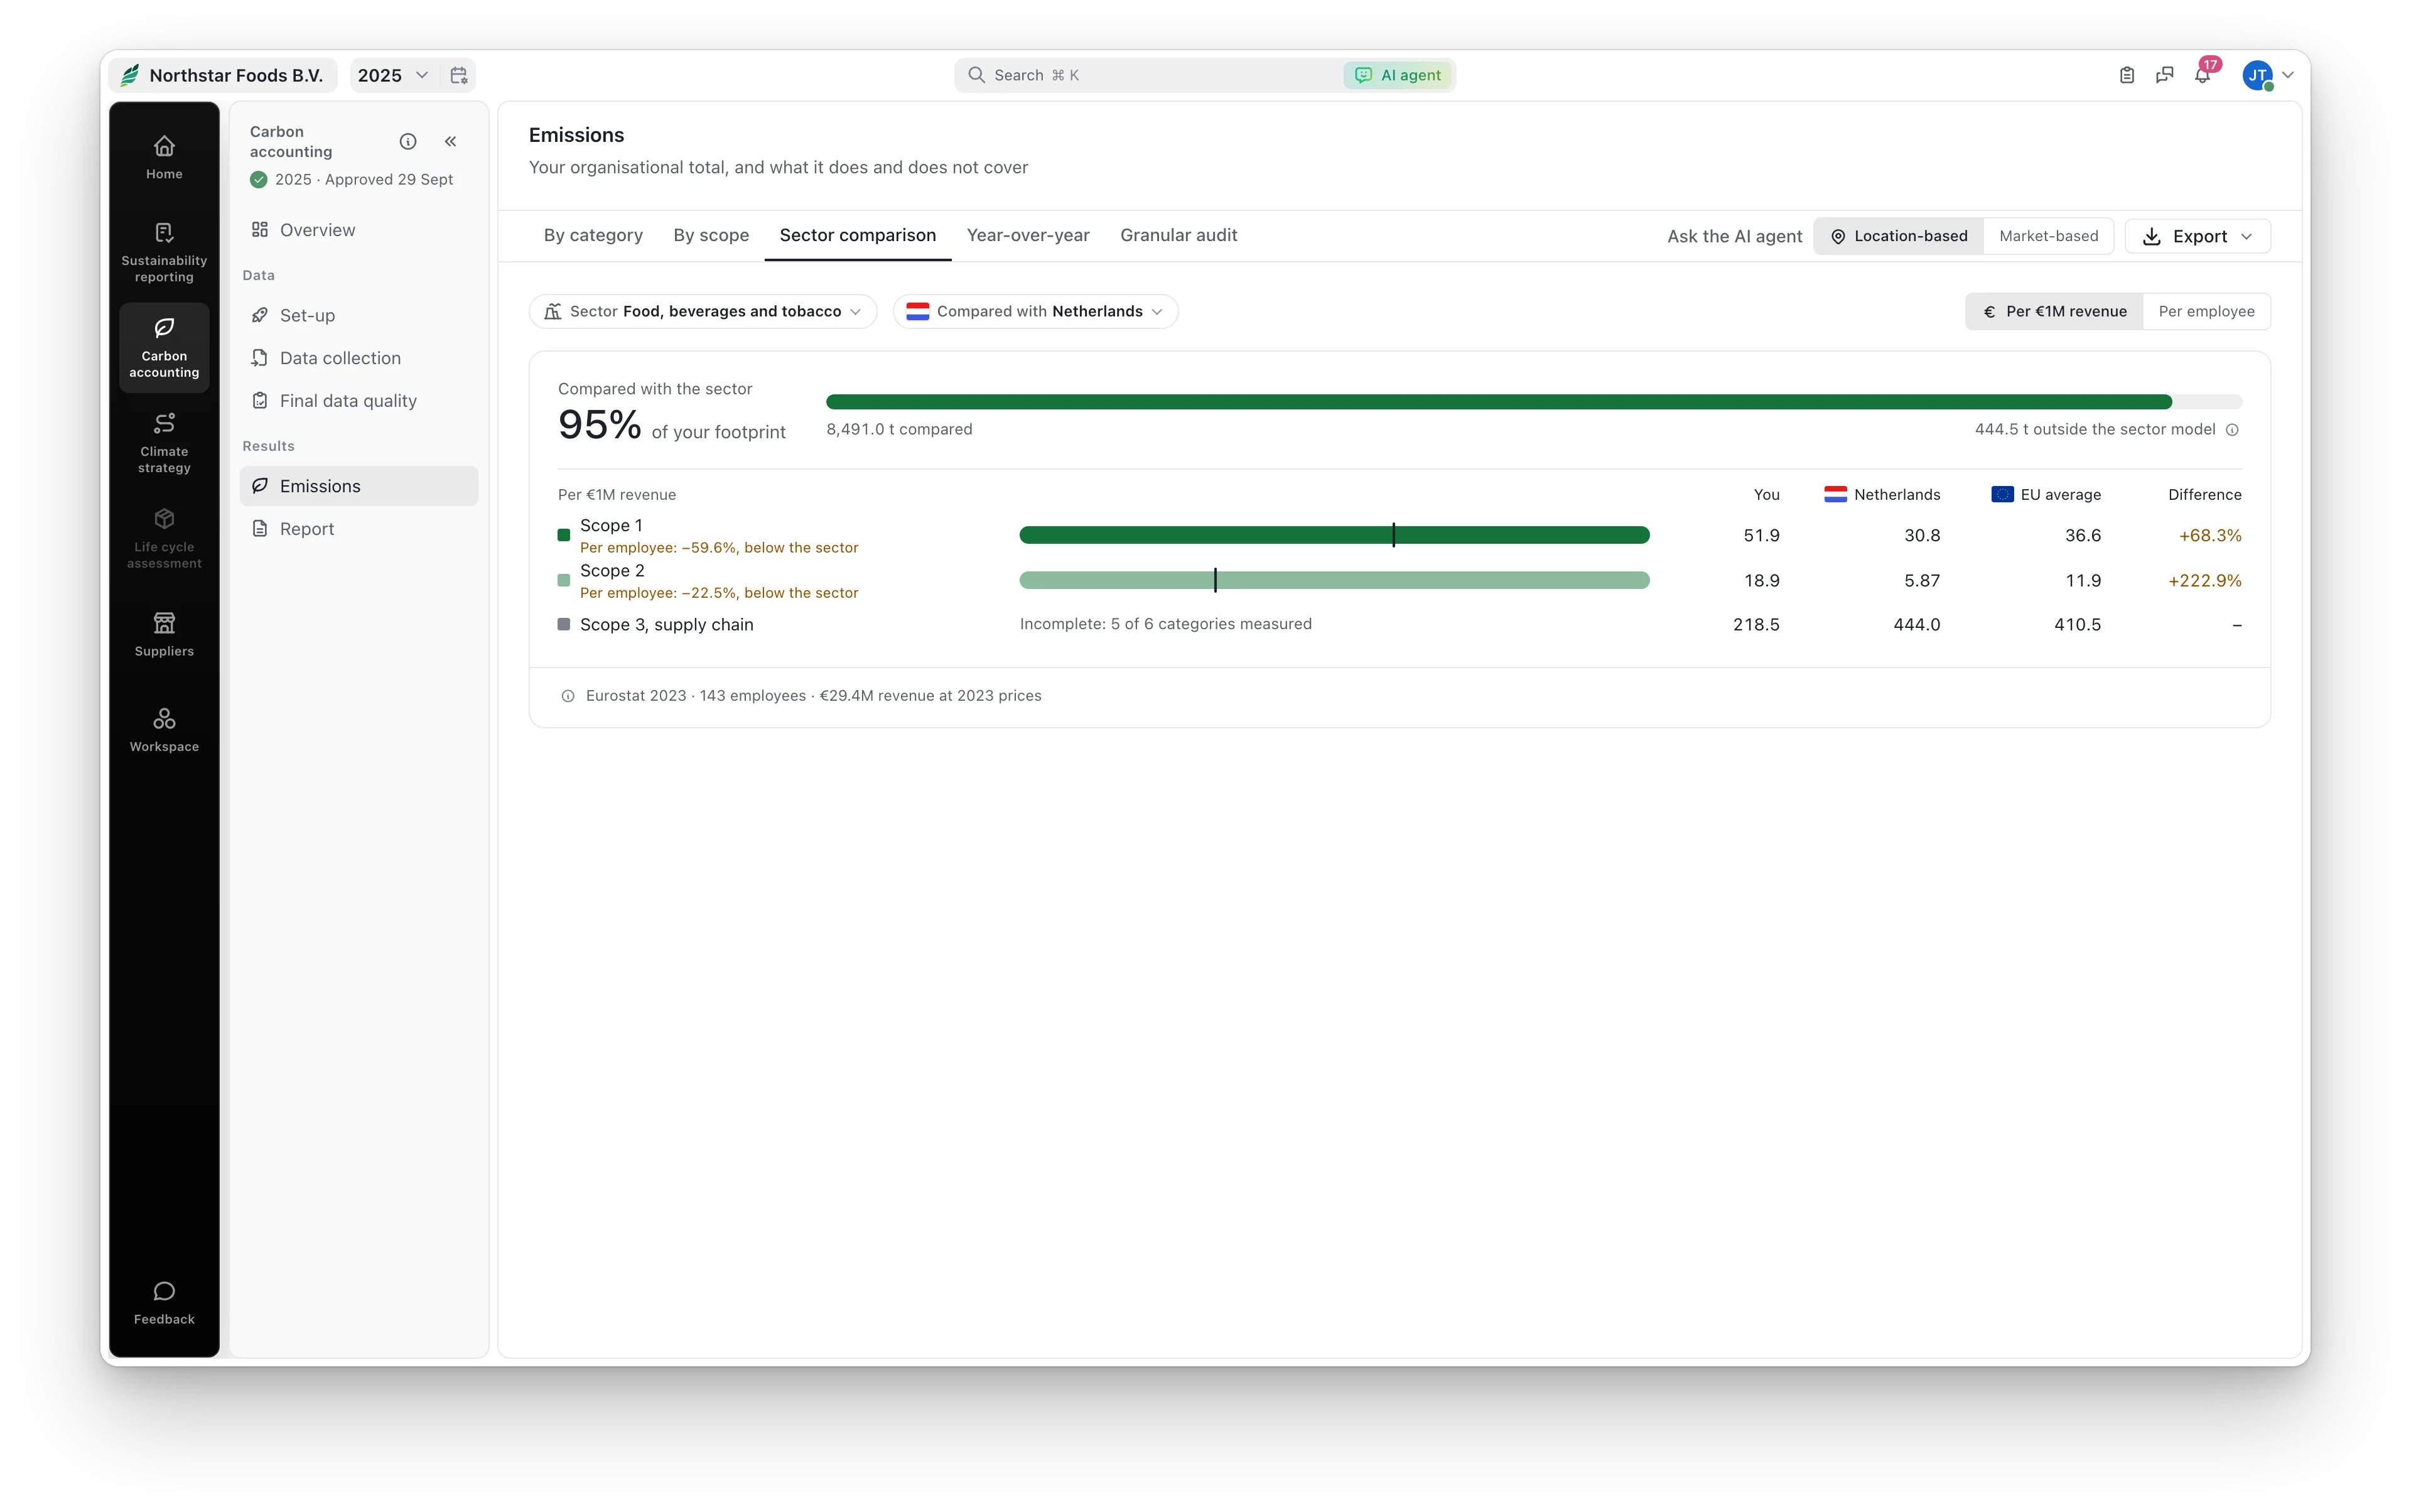
Your emissions intensity next to the average for your sector in the EU, from Eurostat's figures, so a customer's question about your number has context.
Every source against the year before, in total, per employee and per million revenue, so a change never comes as a surprise.
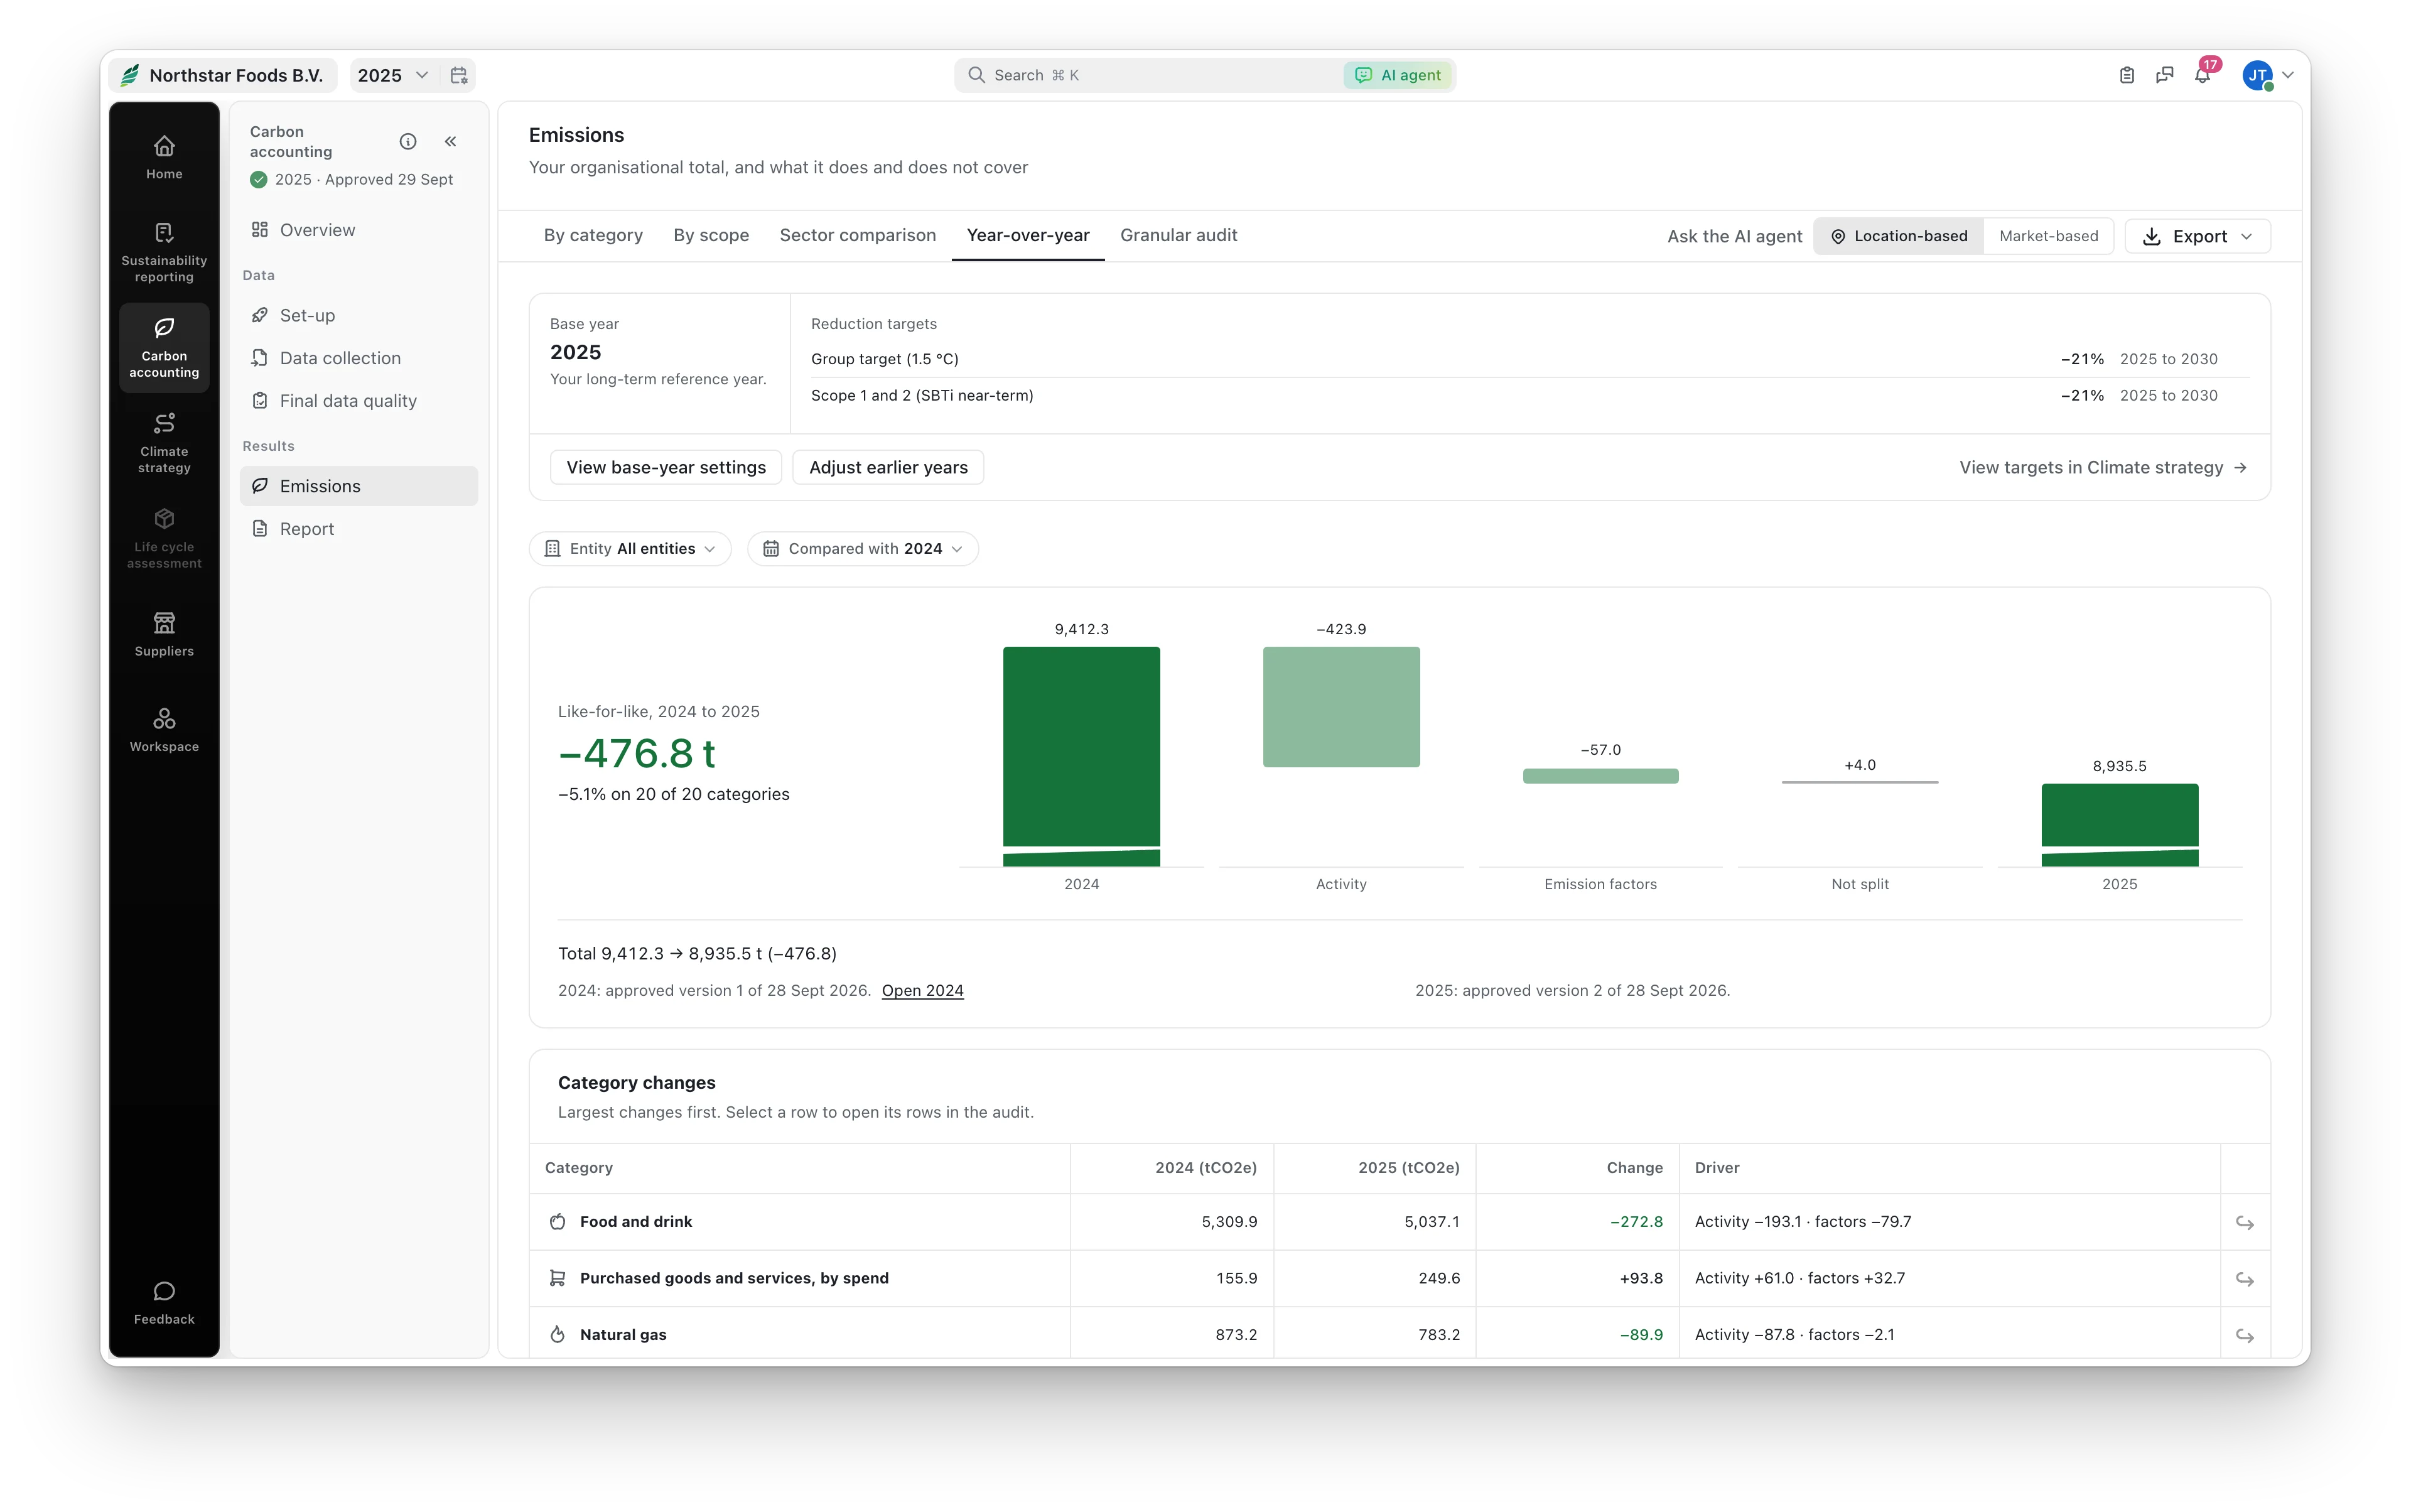
Send suppliers a request. They answer in a portal of their own, in their own language, get a score and certificate they can share, and their figures replace your spend estimates.
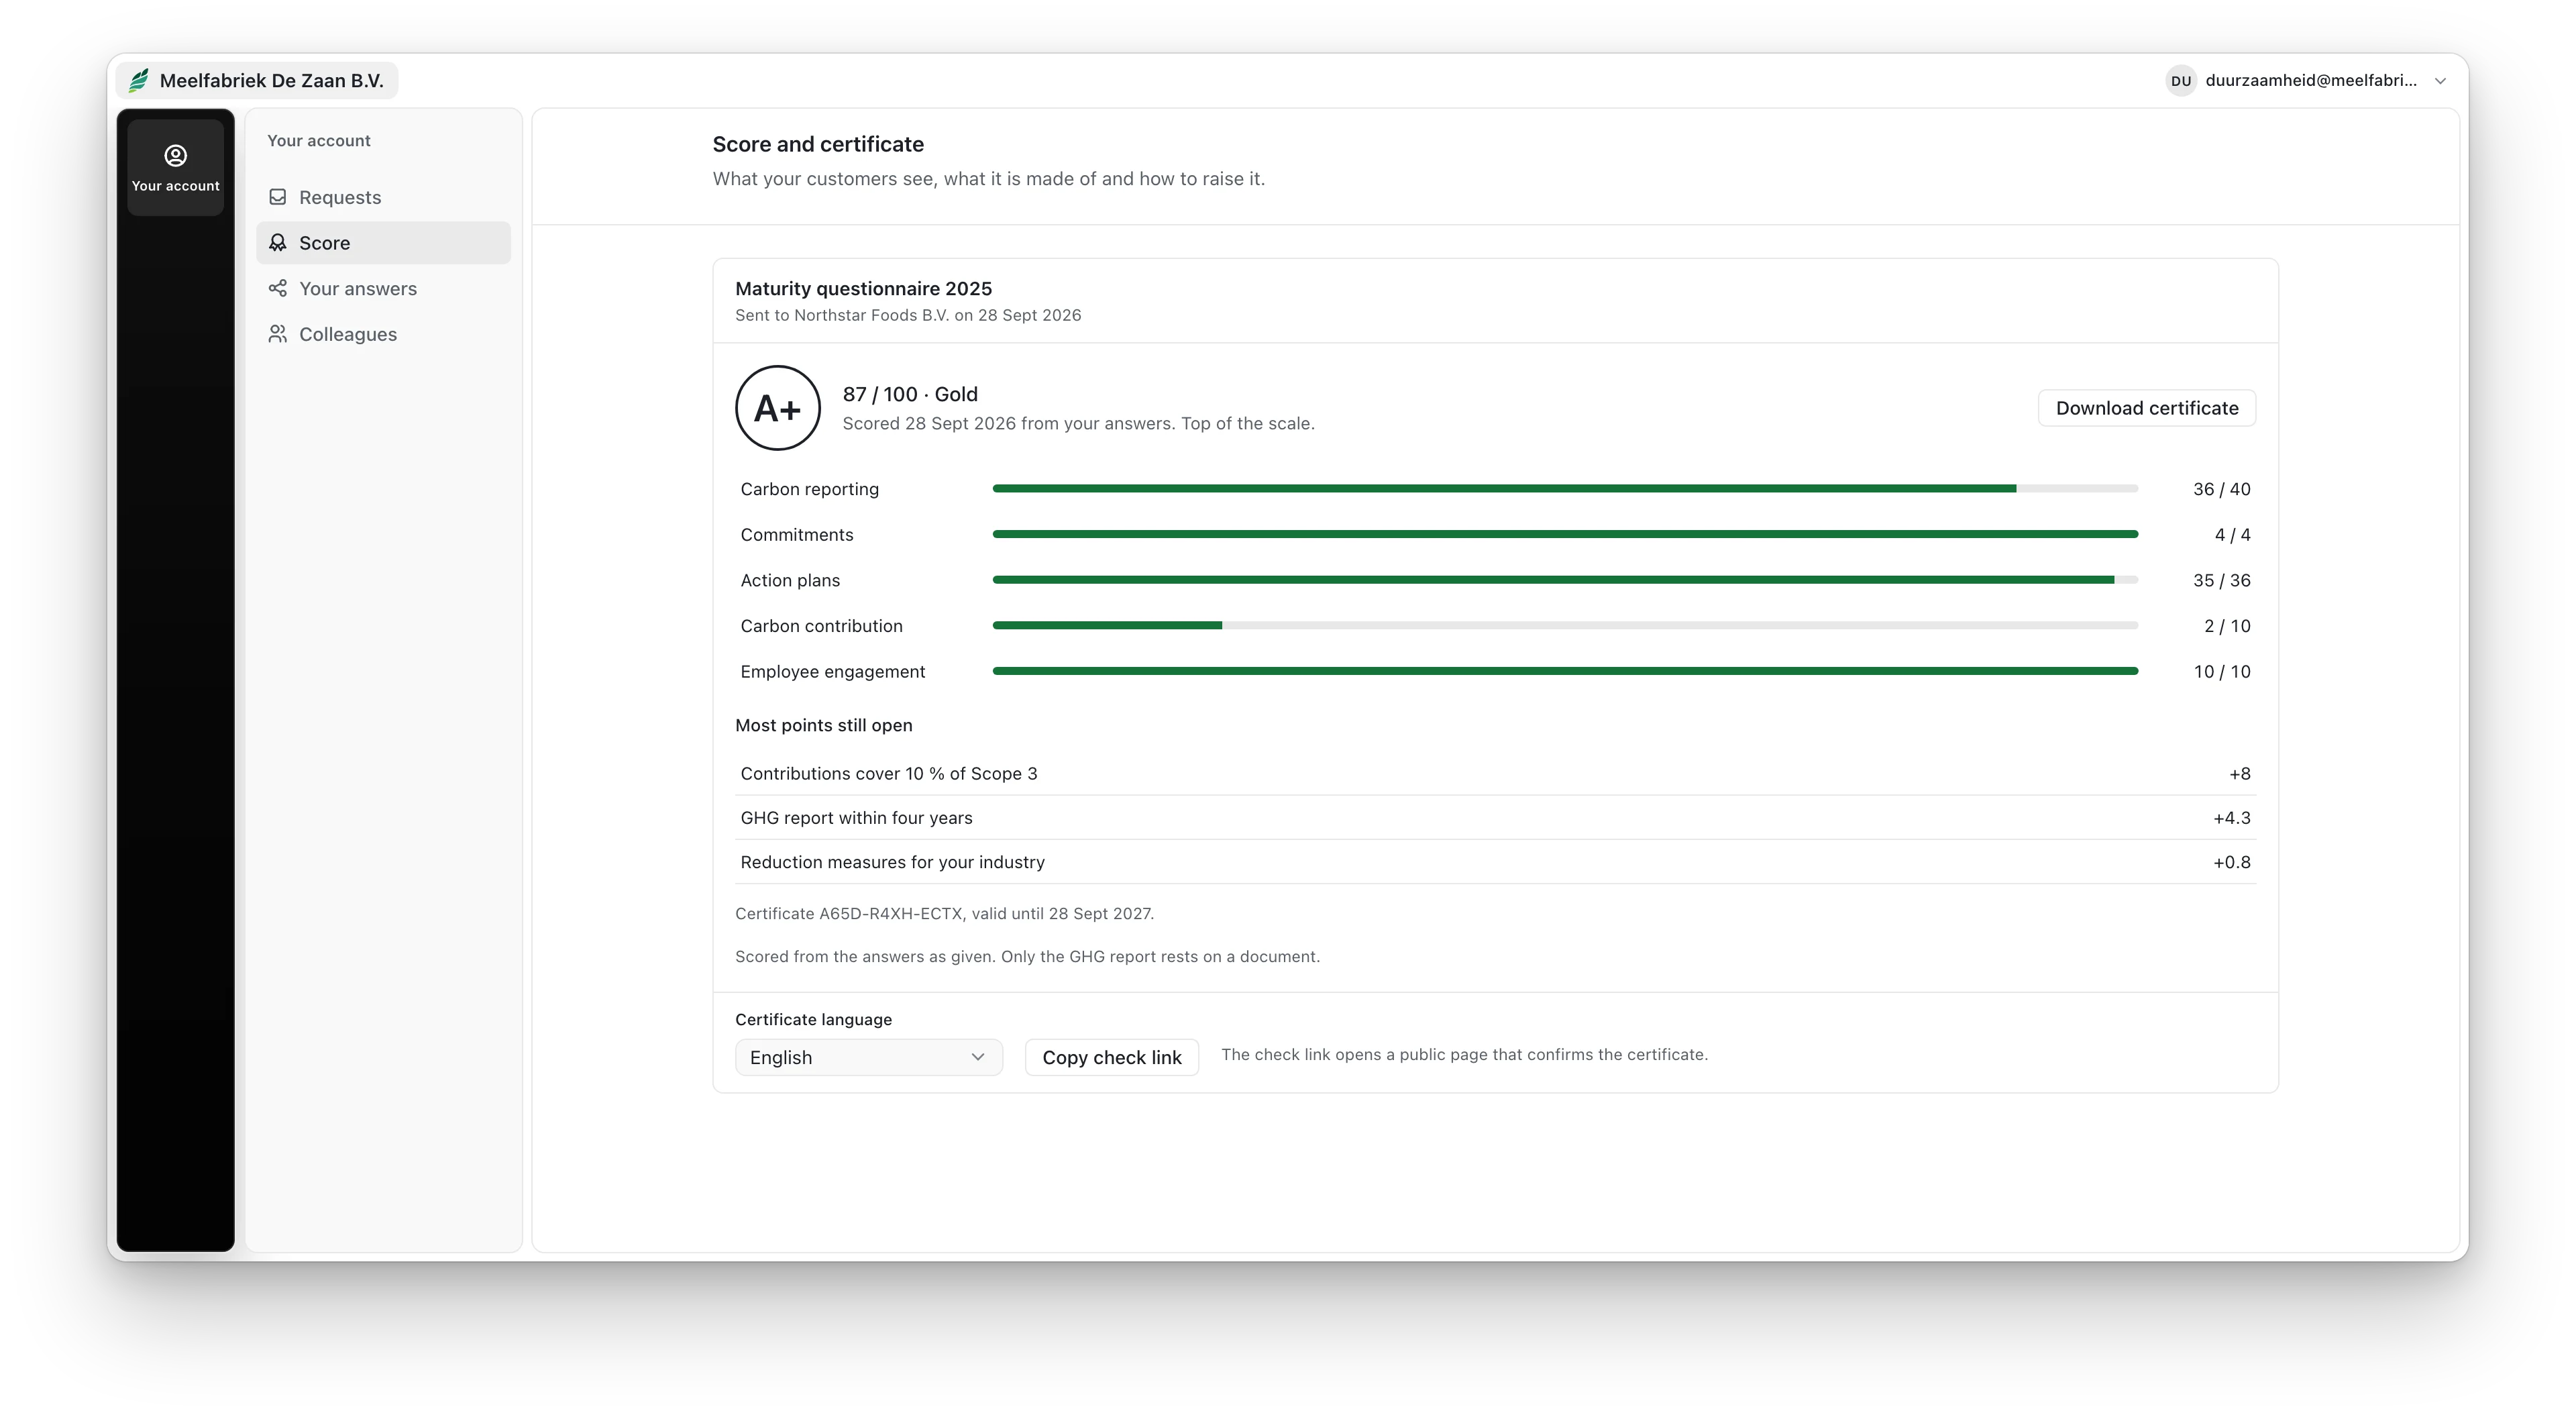
Employees answer a few questions about how they get to work, without an account, and their answers become your commuting emissions.
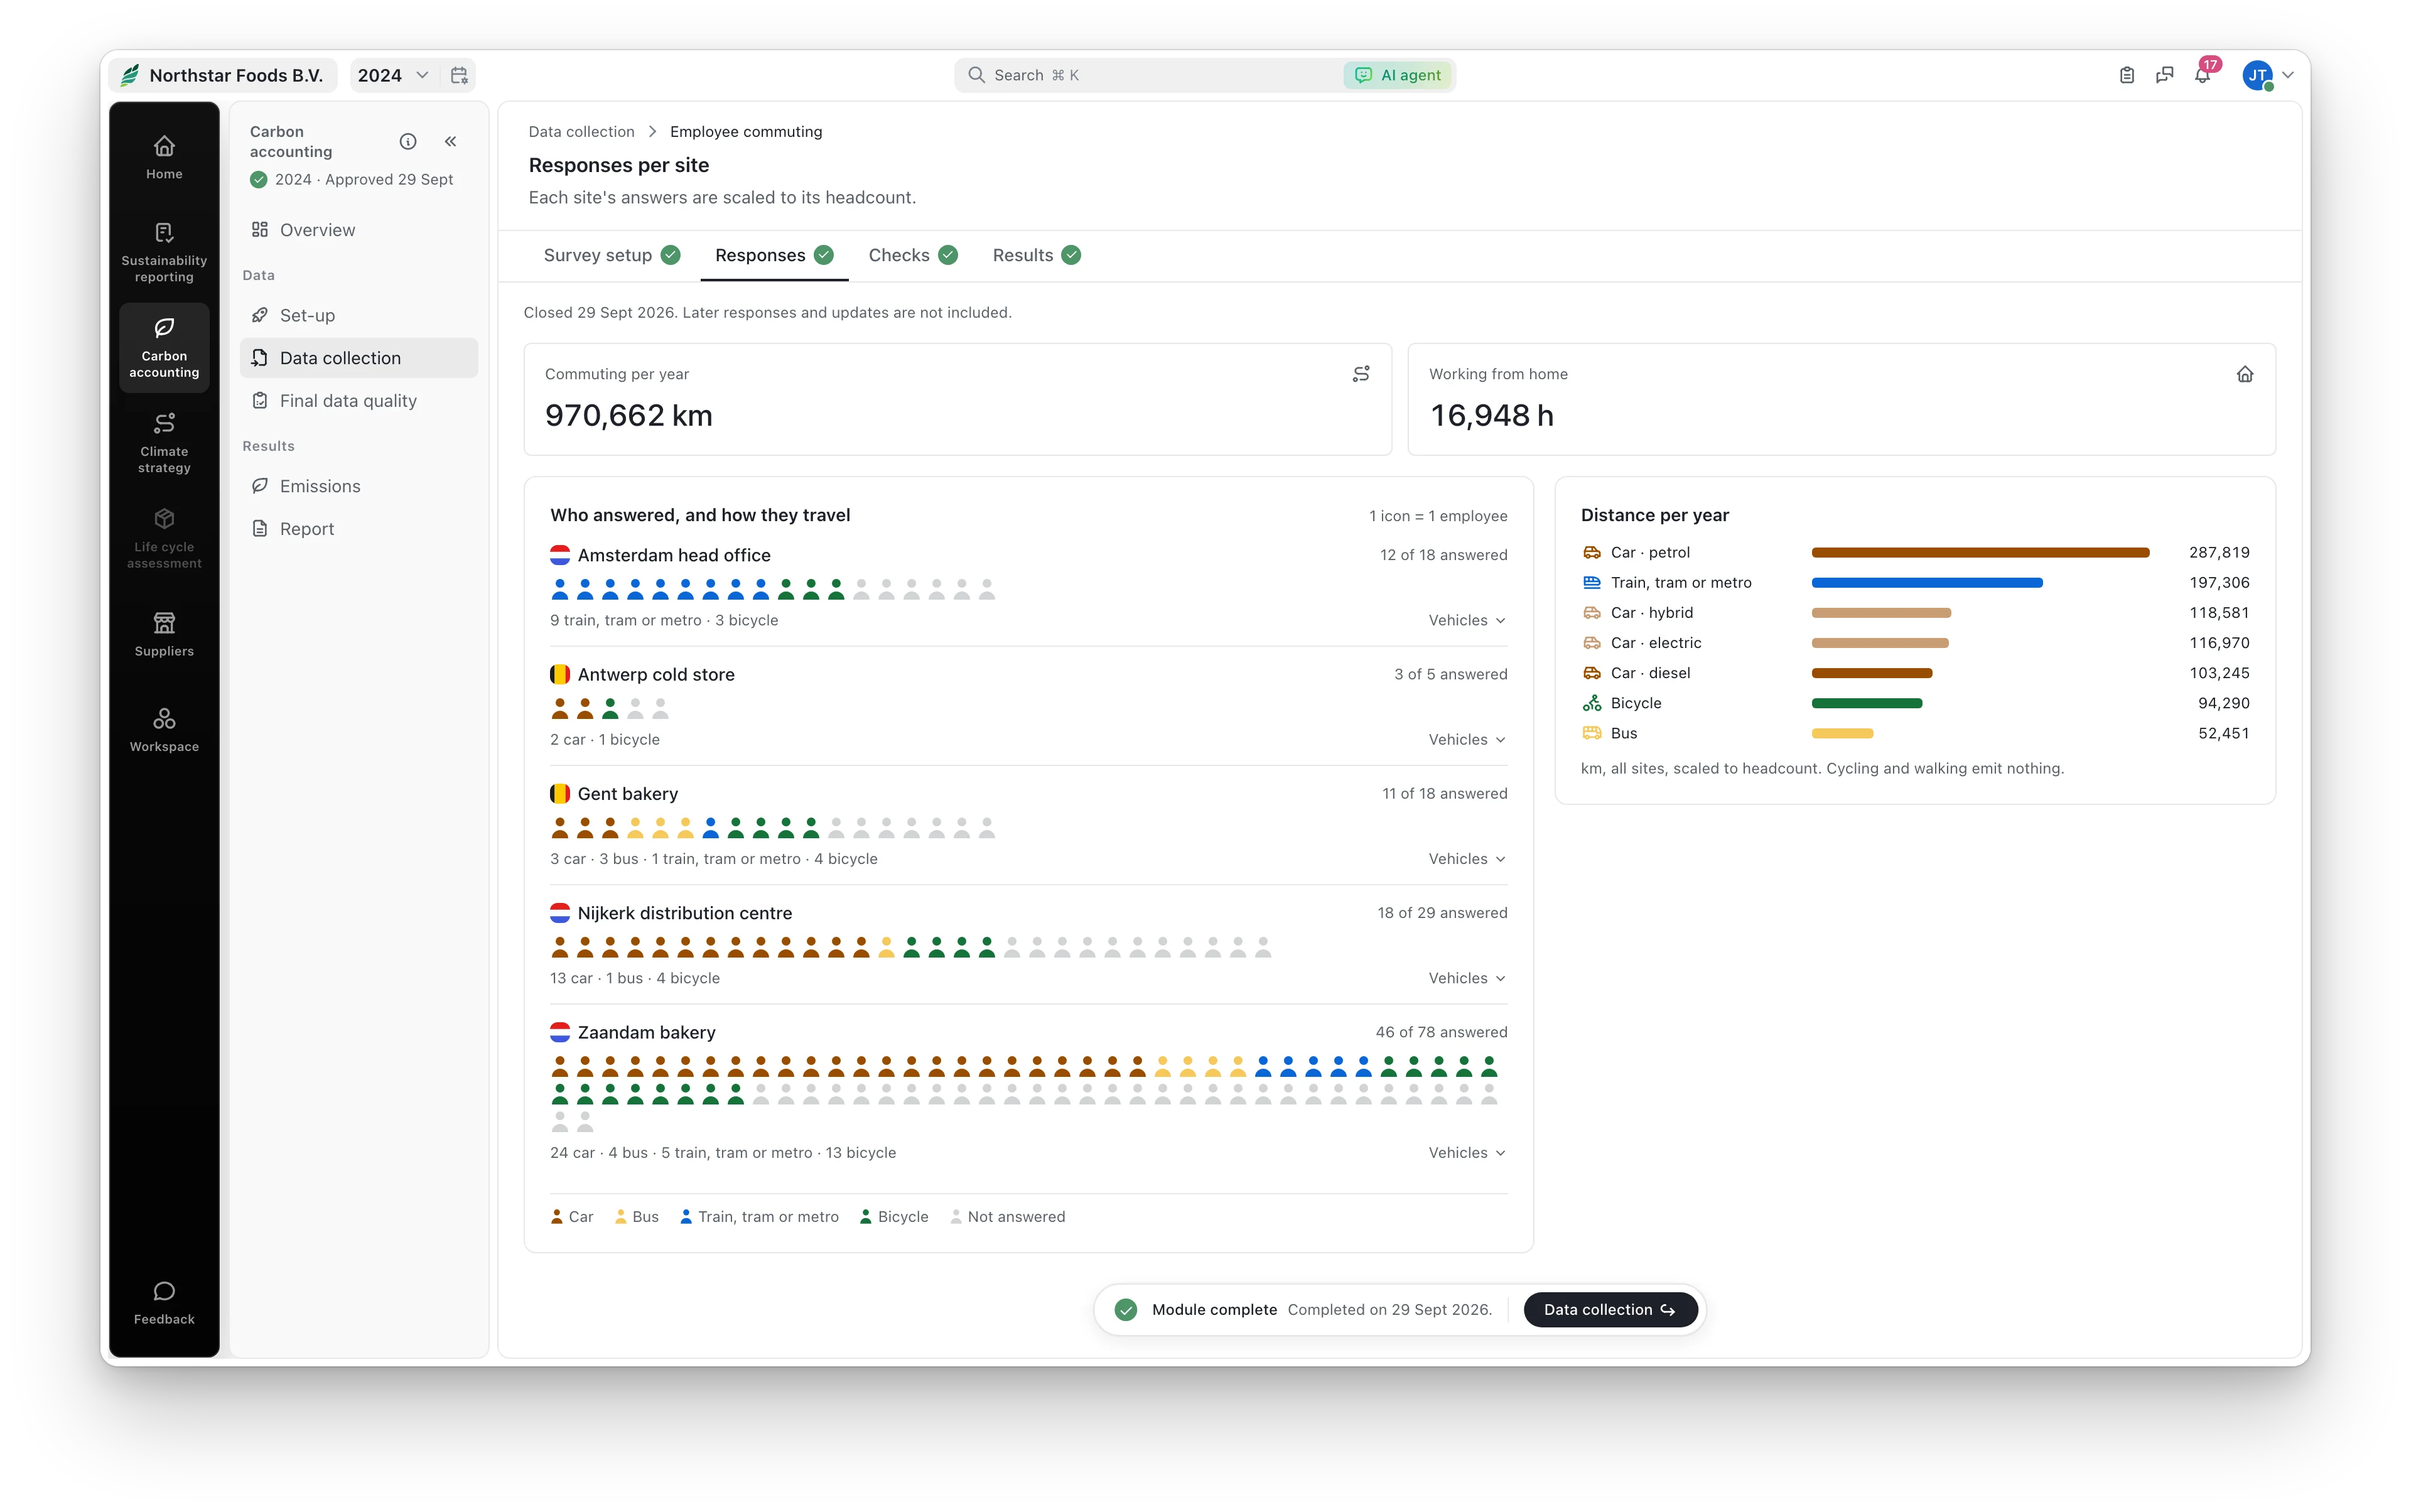
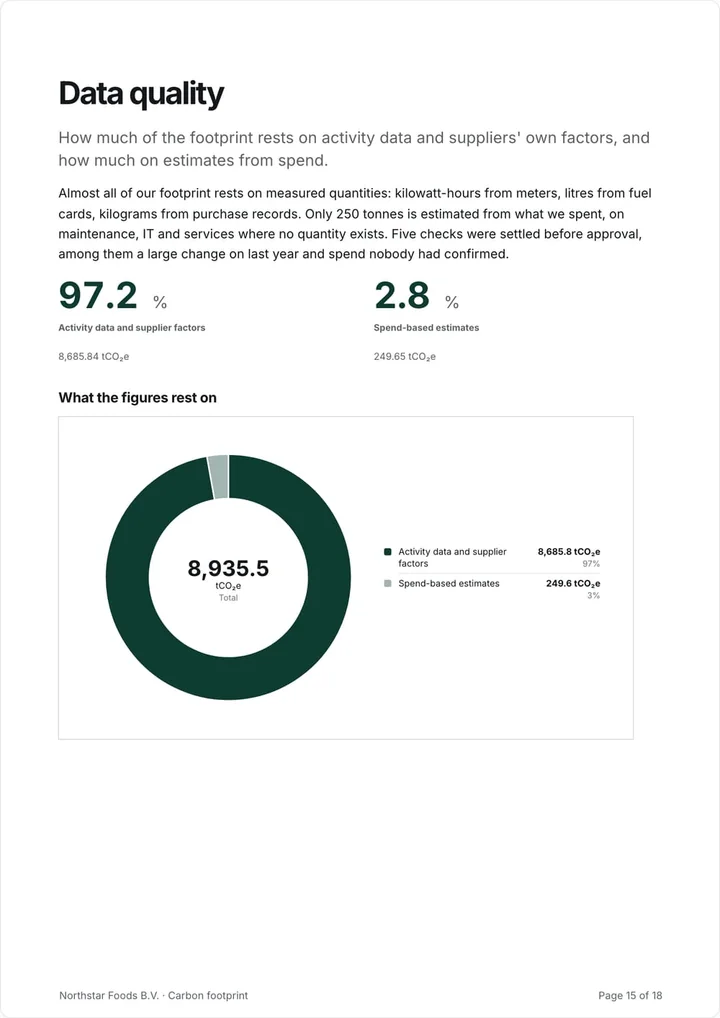
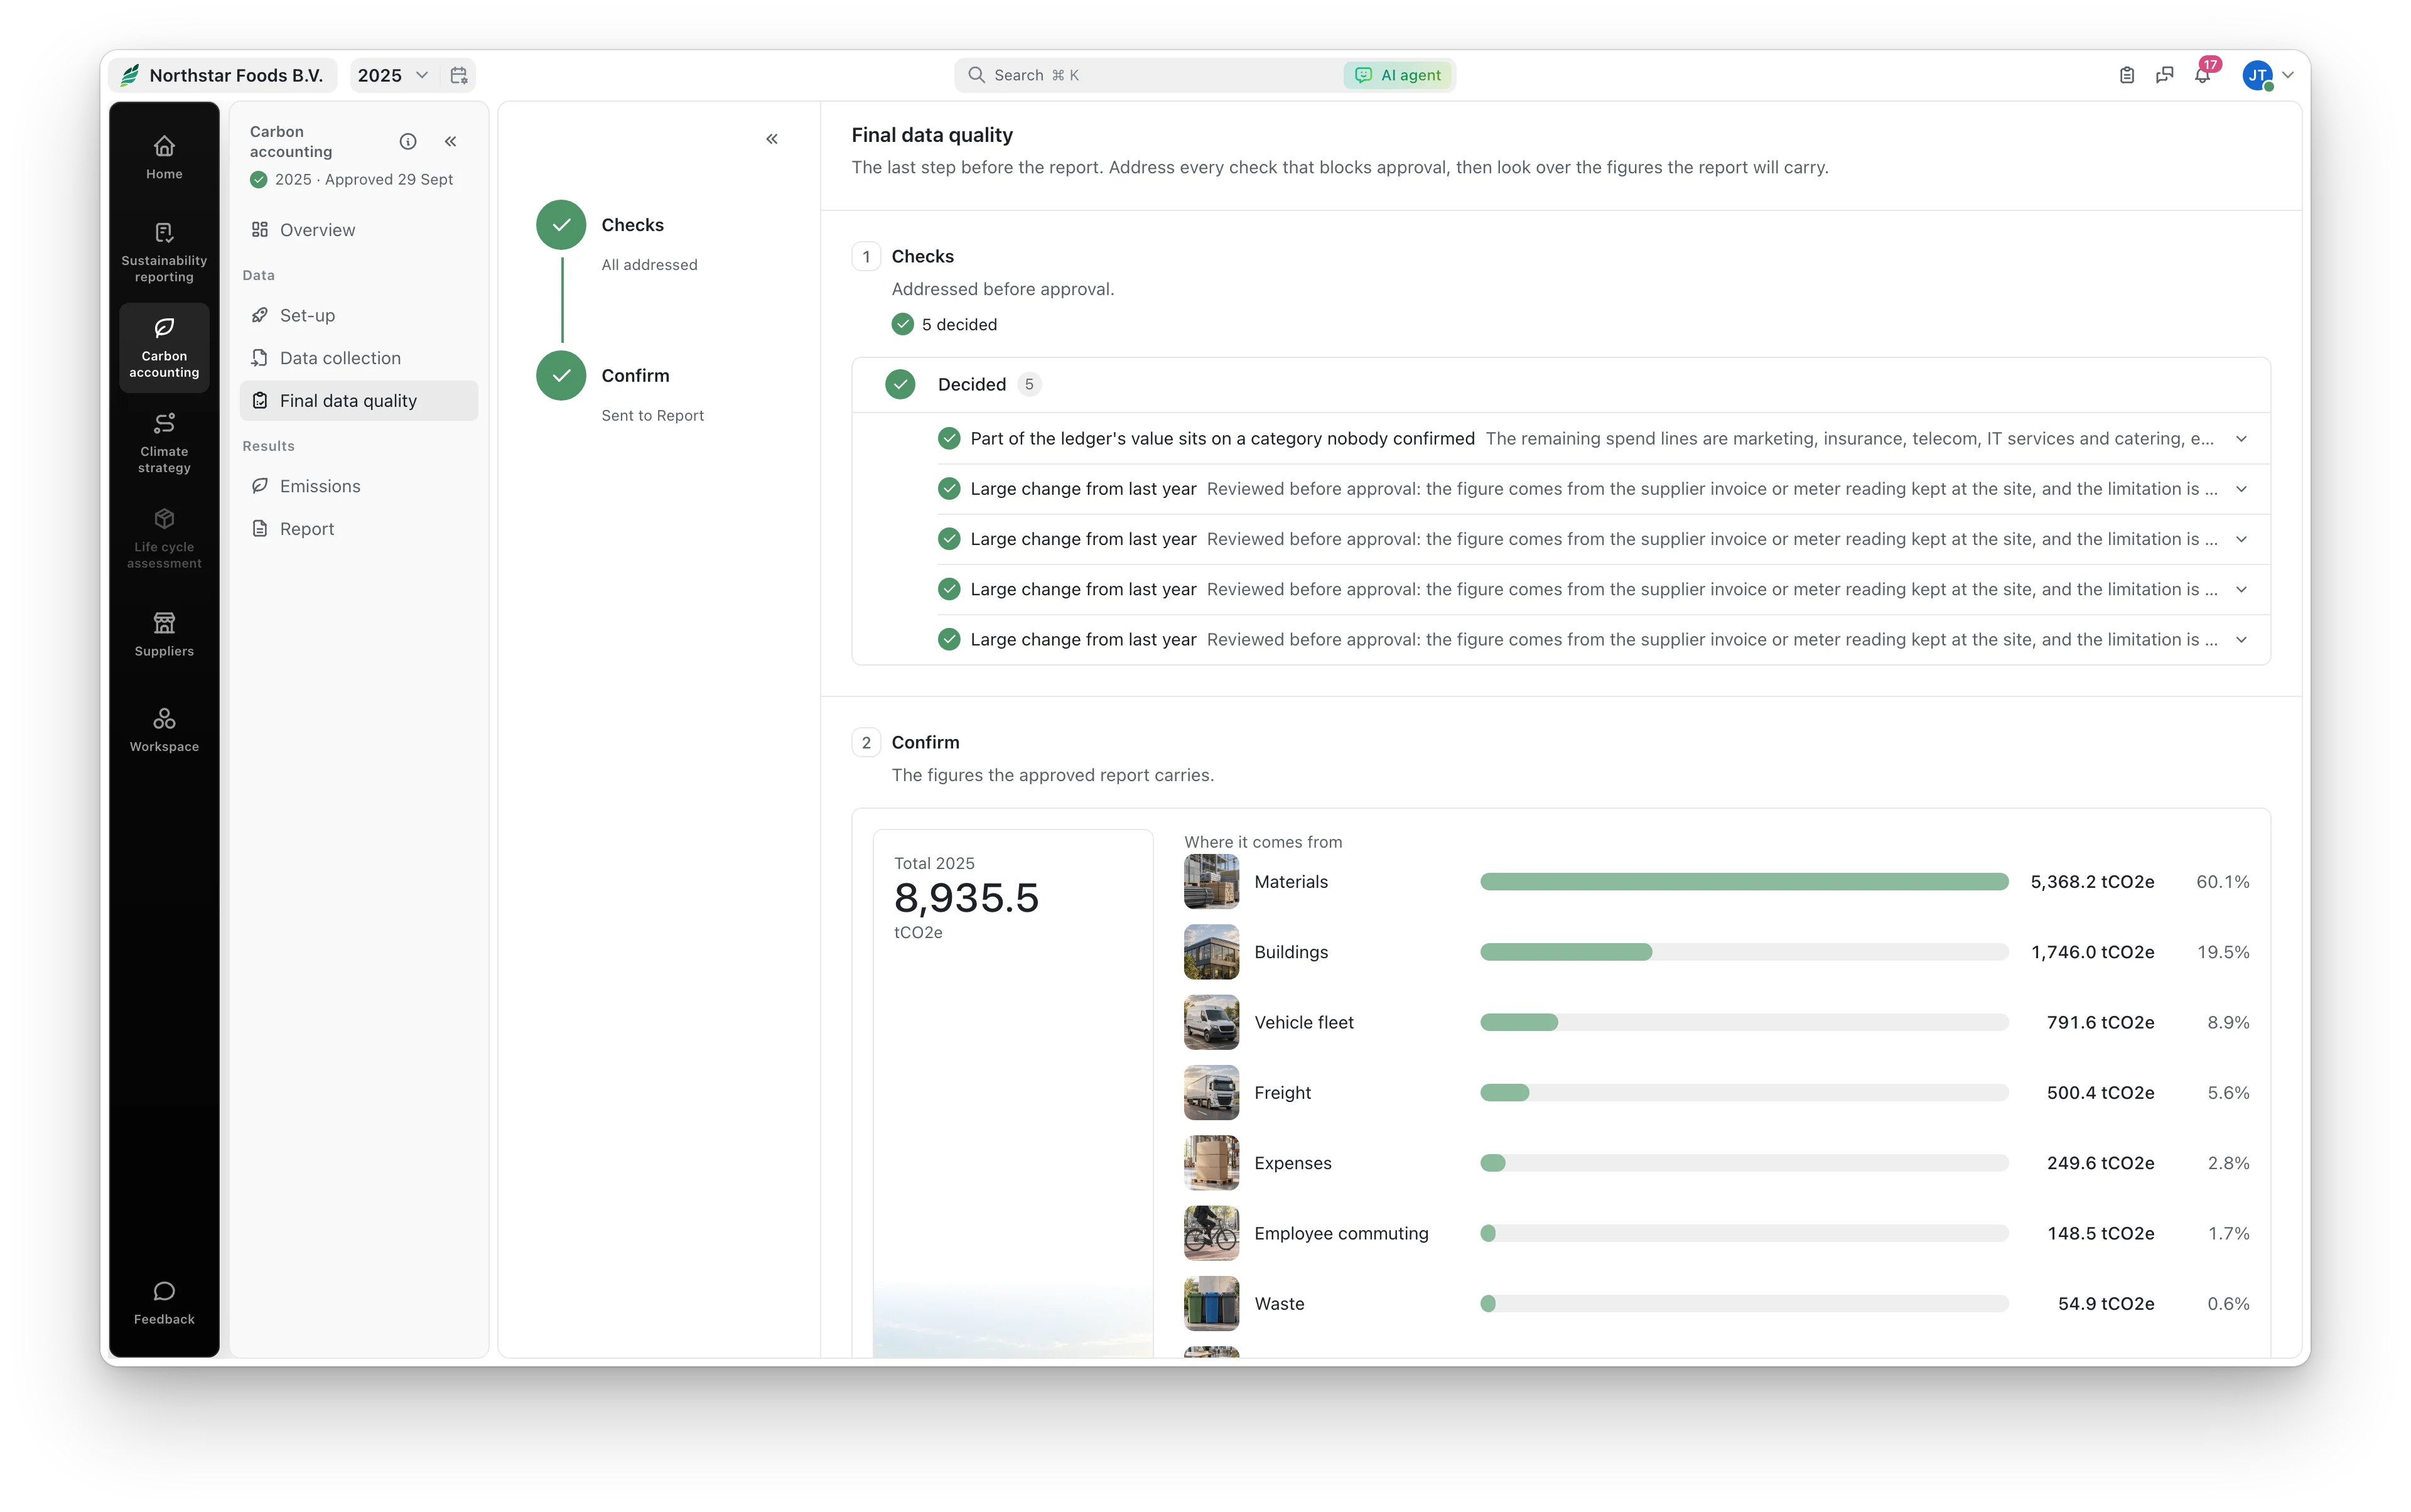
Every check is settled before approval, from a large change on last year to spend nobody confirmed. Then you see exactly what the report will carry, module by module.
Prices in EUR, billed annually, ex VAT.
Single sign-on is available as an add-on, €149 per connection per month, ex VAT.
Find answers to your questions right here, and contact us if you cannot find what you are looking for.
No. Every emission source comes with a plain list of what to collect, from meter readings and fuel cards to purchase lists and travel bookings, and the product does the GHG Protocol calculation for you.
The records you already keep: energy and fuel bills, fuel cards, travel bookings, purchase and waste records. Where a bill is missing, spend, floor area or a flight route fills the gap, and the report says which figures are estimates.
It follows the GHG Protocol across Scope 1, 2 and all 15 Scope 3 categories. Every tonne traces to its record and emission factor, every change is logged and checks run before you approve, so a verifier can follow any figure back to its source.
Send a request. Suppliers answer in a portal of their own, in their own language, without an account, and their figures replace your spend estimates for what you buy from them.
Days, not months, once your records are at hand. Most of the time goes into finding the bills; each figure is calculated the moment you enter it.
Your workspace becomes read only for 90 days so you can take everything out as PDF or Excel. Nothing is deleted while you are exporting, and we tell you before it is.