Scope 3 is the emissions in your value chain, split into 15 categories by the GHG Protocol. For most companies outside finance a few matter most: purchased goods and services, transport, business travel, commuting and waste. Screen all 15, estimate the relevant ones from spend, distance or surveys, and replace the biggest estimates with supplier data over time.
What Scope 3 is
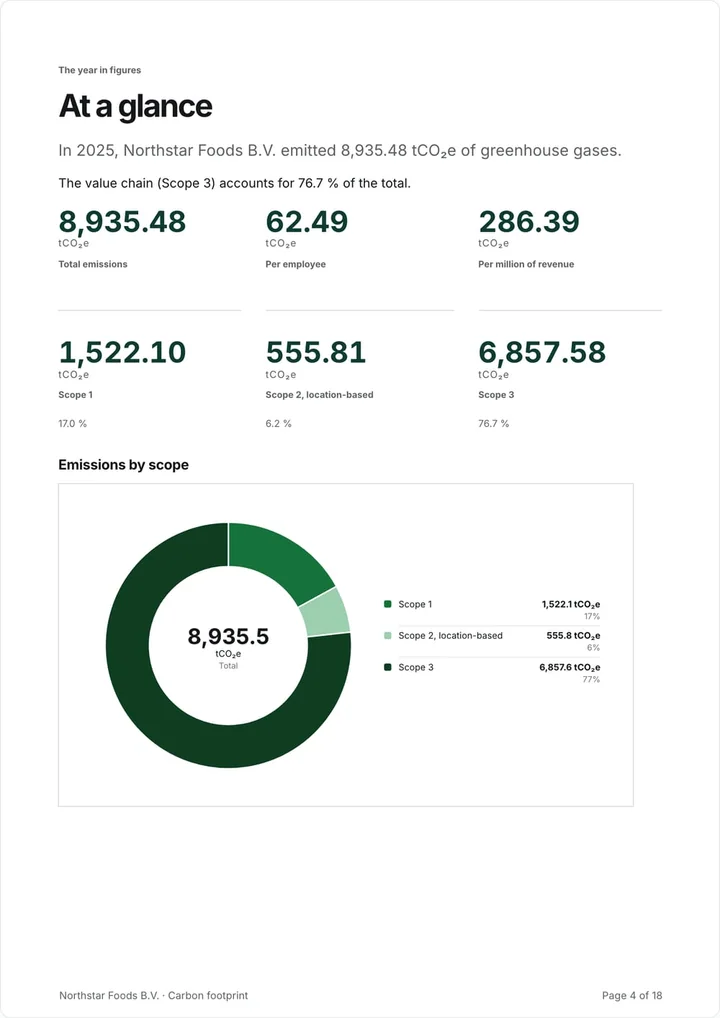
Scope 3 covers the emissions in your value chain that you do not cause directly: what you buy, how it is transported, how your staff travel and commute, and what happens to your products after they leave you. For most companies it is the largest part of the footprint, often by far.
The GHG Protocol’s Corporate Value Chain (Scope 3) Standard splits it into 15 categories: eight upstream, in your supply chain, and seven downstream, after the sale. You report the categories that are relevant to your business, and explain the ones you leave out.
Why your customers ask for it
A large customer’s Scope 3 includes your emissions as its supplier. When it reports, it wants figures from you rather than an estimate from your invoice amount. Banks and tenders increasingly ask for Scope 3 as well. The VSME Basic module asks for Scope 1 and 2, so Scope 3 usually comes up because a customer, bank or tender asks for it.
Which categories usually matter
For a typical smaller manufacturer, wholesaler or service company, a handful of categories make up almost all of Scope 3. Purchased goods and services comes first and is often more than half. Then upstream transport, business travel, employee commuting, waste and, for companies that use energy, the fuel- and energy-related emissions on top of Scope 1 and 2. Companies that sell physical products may also need the use and end of life of those products.
Screen all 15 once, write down why a category is or is not relevant, and spend your effort on the biggest ones.
Estimate first, then improve
You do not need perfect data to start. Purchases can be estimated from spend per category, multiplied by a spend-based emission factor. Travel can be estimated from distances, commuting from a short survey, waste from tonnes per treatment. Replace the largest estimates with supplier-specific figures over time.
Greener Ahead’s Carbon accounting covers all 15 categories. Suppliers answer a request in their own portal and their figures replace your spend estimates, and employees fill in a short commuting survey without an account. It costs €1,495 per year with unlimited users, with a 14-day free trial without a card. Check the pricing page for current details.
All 15 categories at a glance
Categories 1 to 8 are upstream, in your supply chain; 9 to 15 are downstream, after the sale. The last column shows where the data for a first estimate usually comes from.
| Category | What it covers | Data for a first estimate |
|---|---|---|
| 1. Purchased goods and services | Everything you buy that is not capital goods | Purchase ledger by category, or supplier data |
| 2. Capital goods | Machines, vehicles, buildings and IT you buy | Asset purchases in the year |
| 3. Fuel- and energy-related activities | Producing and transporting the fuel and electricity you use | Your Scope 1 and 2 energy figures |
| 4. Upstream transport and distribution | Transport of what you buy, and transport you pay for | Freight invoices, in tonne-kilometres or euros |
| 5. Waste generated in operations | Disposal and treatment of your waste | Waste invoices, in tonnes per treatment |
| 6. Business travel | Flights, trains, hotels and hire cars for work | Travel bookings or expense claims |
| 7. Employee commuting | Staff travelling between home and work | A short survey of distance and mode |
| 8. Upstream leased assets | Assets you lease that are not in Scope 1 and 2 | Lease contracts and energy use |
| 9. Downstream transport and distribution | Transport of sold products that you do not pay for | Sales volumes and typical routes |
| 10. Processing of sold products | Further processing of intermediate products by customers | Customer process information |
| 11. Use of sold products | Energy used by your products during their life | Product energy use and lifetime |
| 12. End-of-life treatment of sold products | Disposal of your products and packaging | Product weights and materials |
| 13. Downstream leased assets | Assets you own and lease to others | Lease contracts and tenants’ energy use |
| 14. Franchises | Operations of your franchisees | Franchisee energy and activity data |
| 15. Investments | Emissions of companies you invest in | Investee emissions, mainly for financial firms |
Four ways to calculate a category
The GHG Protocol accepts several methods. Use the best one you can for the biggest categories and say which method you used.
- Spend-based: euros spent per category times an emission factor per euro. Quick, but rough.
- Average-data: physical amounts, such as kilograms or kilometres, times an average factor.
- Supplier-specific: emissions reported by the supplier for what you bought from them.
- Survey-based: for commuting, the distance and mode reported by each employee.
A first Scope 3 inventory in four steps
Keep the first year simple and document every choice, so next year’s improvement shows as better data rather than as a change in method.
- Screen all 15 categories and record why each is relevant or not.
- Estimate the relevant categories with the data you already have.
- Rank them by size and pick the two or three largest to improve.
- Ask the suppliers behind the largest purchases for their own figures.
Sources and scope
- GHG Protocol: Corporate Value Chain (Scope 3) Standard
- GHG Protocol: Technical Guidance for Calculating Scope 3 Emissions
These resources explain a preparation workflow. Check your selected standard and recipient requirements before sharing your report.
 Joost ThissenFounder