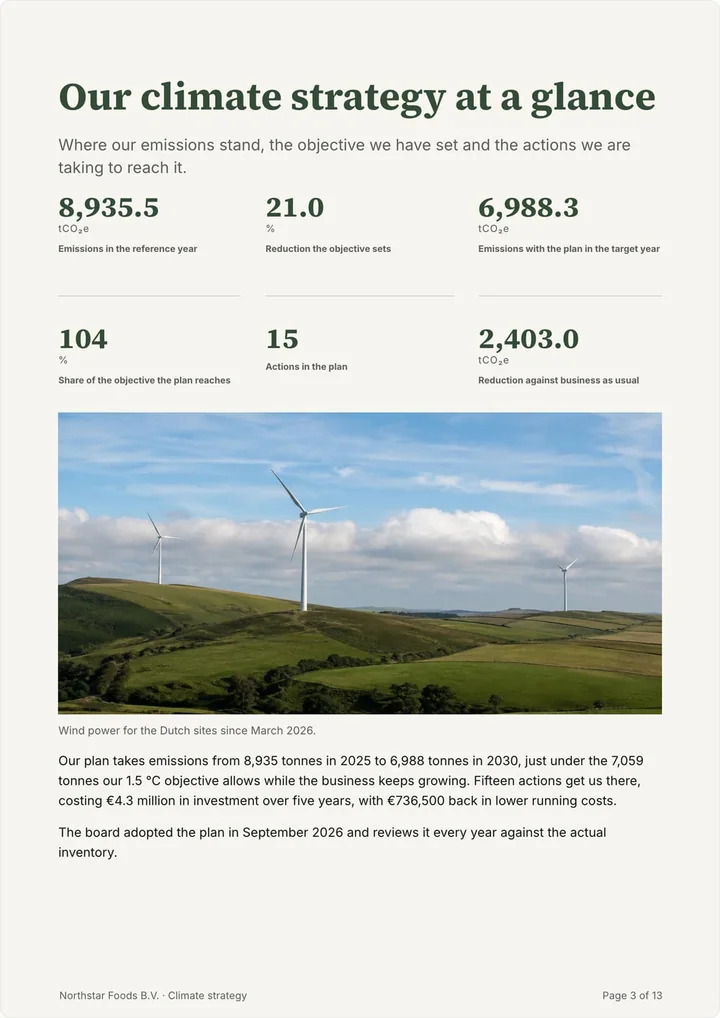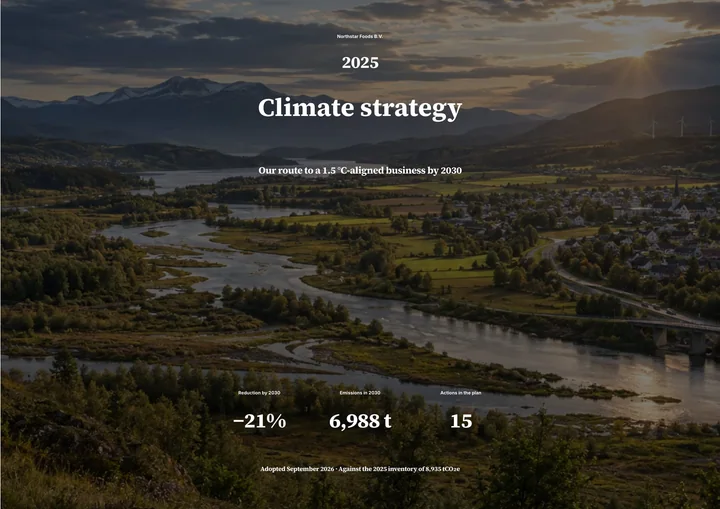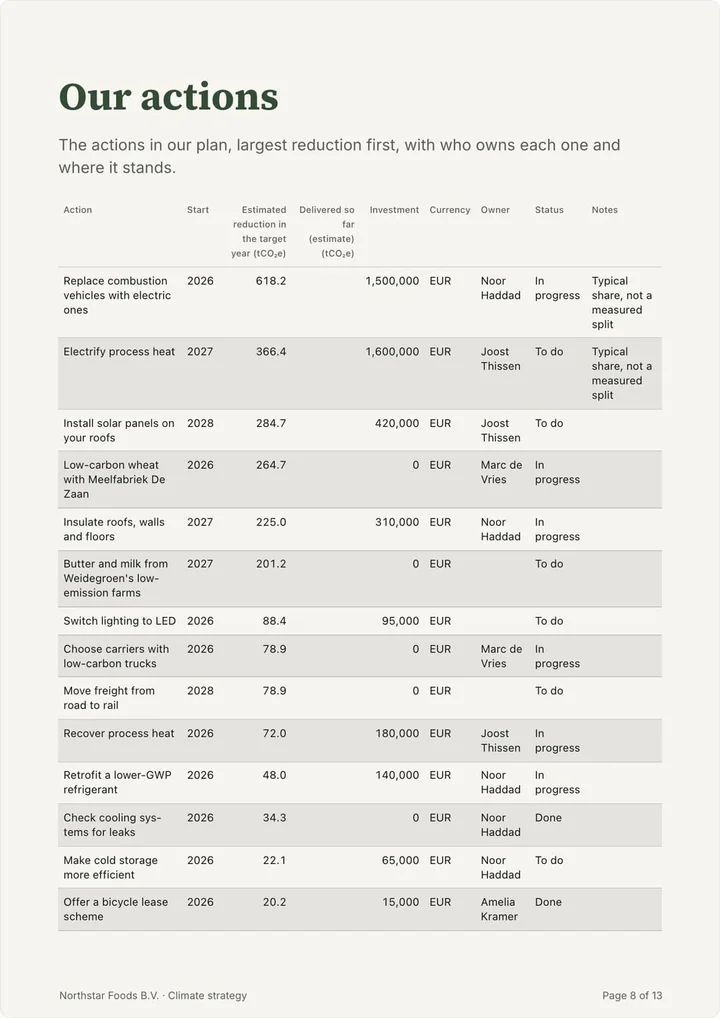
A decarbonisation plan lists the measures that will cut your emissions, each with its expected reduction in tCO₂e, cost, timing and owner. Build it from your footprint: start with the three to five largest sources, rank the measures by impact and cost, time investments with equipment replacement, check that the total reaches your target, and review it every year against the new footprint.
What a decarbonisation plan is
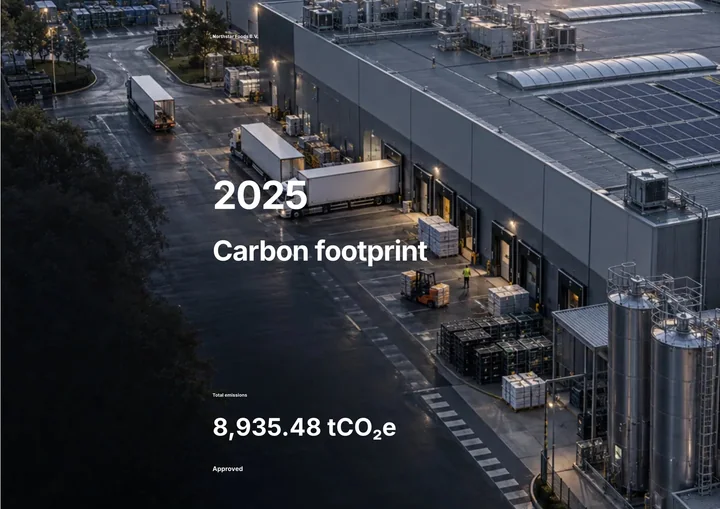
A decarbonisation plan is the list of measures your company will take to reduce its greenhouse gas emissions, with for each measure the expected reduction, the cost, the timing and the person responsible. It connects your carbon footprint, which shows where emissions come from, to your reduction target, which says how far and how fast they have to fall.
A plan is about reducing your own emissions. Buying carbon credits to compensate is a separate decision: credits do not count towards a science-based reduction target, and a plan that relies on them is not a decarbonisation plan.
Start from the biggest sources
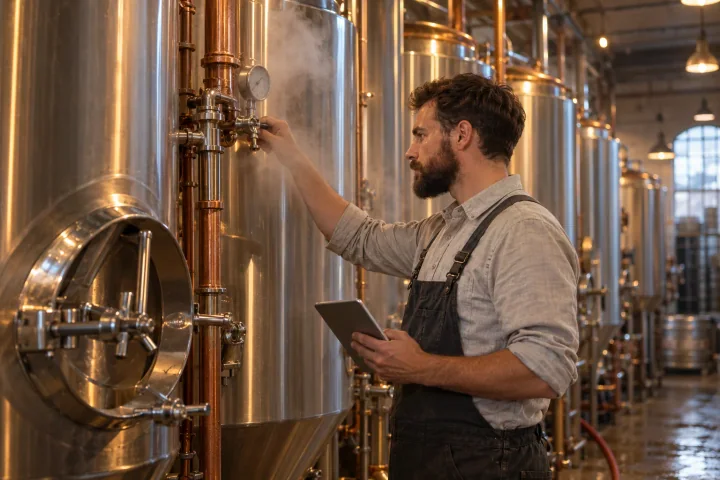
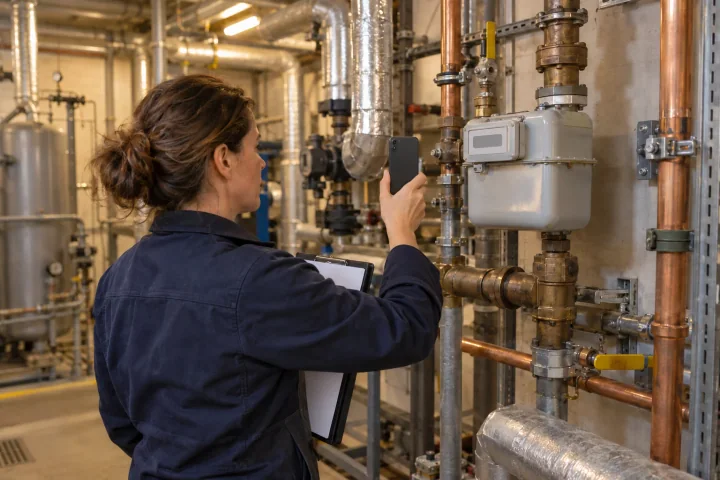
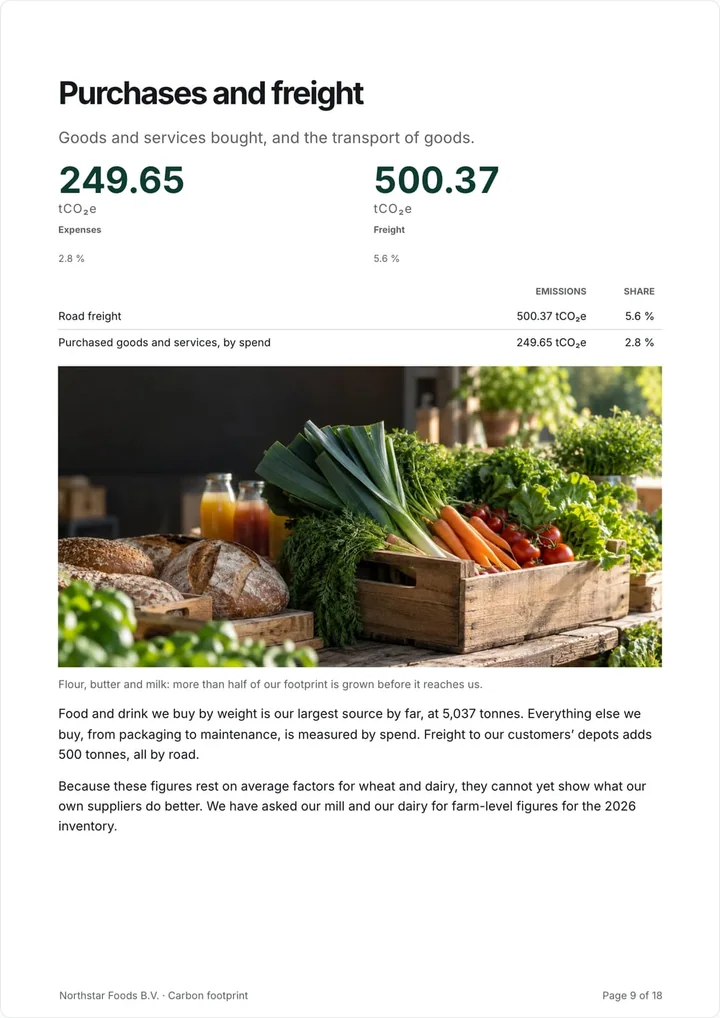
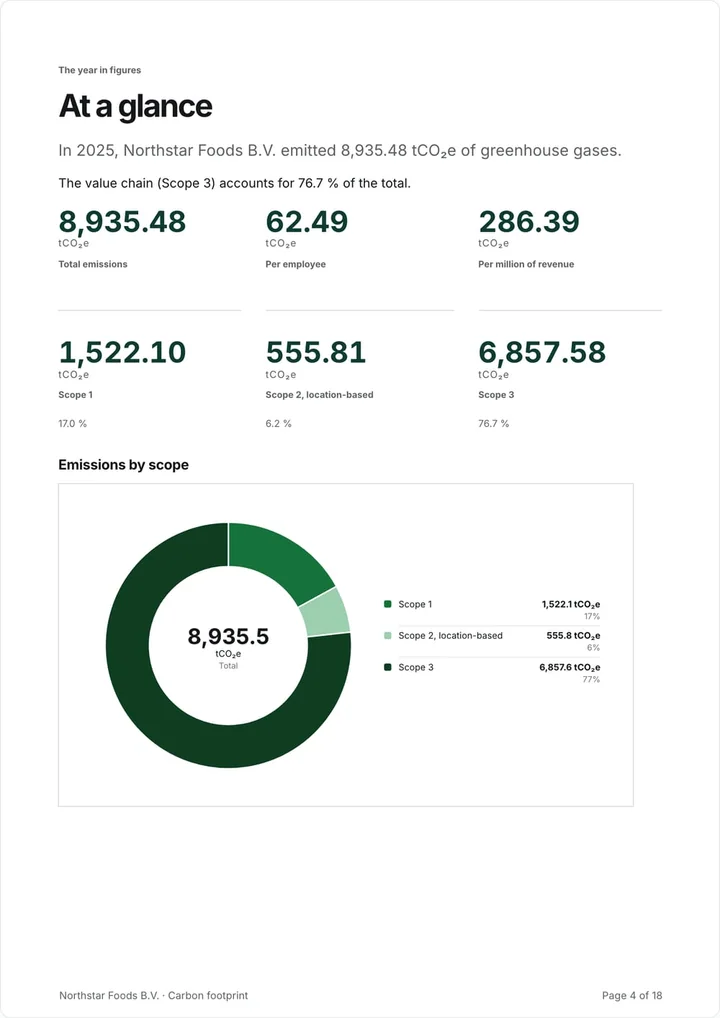
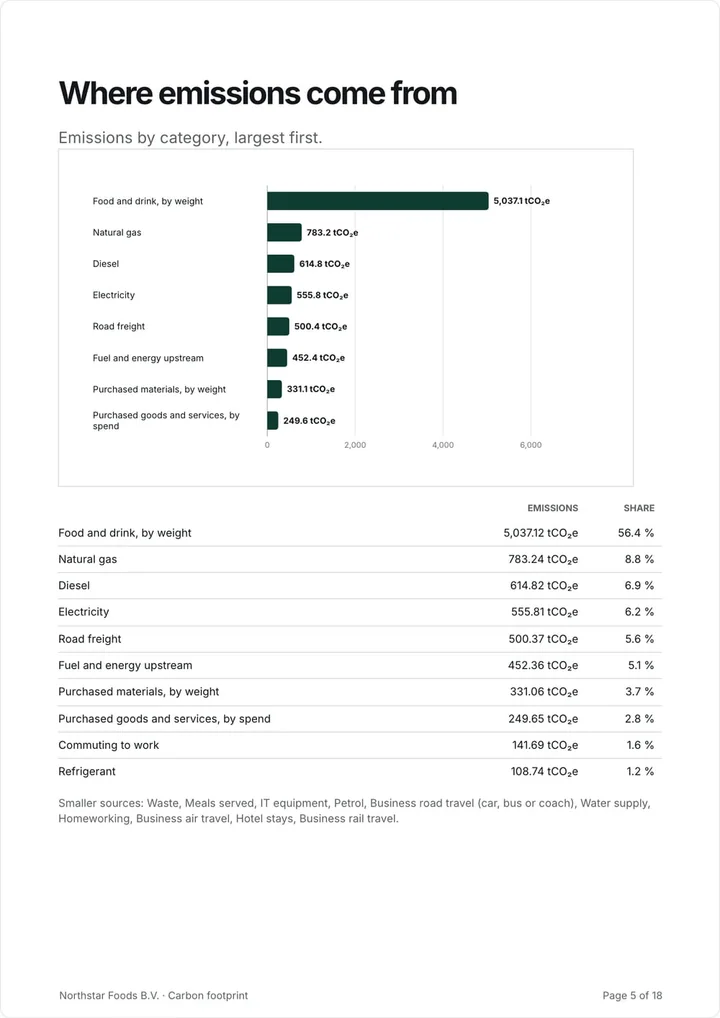
Open your footprint and sort it by source. In most companies three to five sources make up most of the total, and those are where the plan should start. Typical large sources are gas for heating, diesel in company vehicles, purchased electricity, purchased goods and materials, and business travel. Refrigerant leaks are small in volume but can be large in CO₂ equivalent.
For each large source, ask what drives it. Heating depends on the building and the system; vehicle emissions on the fleet, the routes and the fuel; purchased goods on what you buy, how much and from whom. The driver tells you which measure can work.
Rank the measures by impact, cost and effort
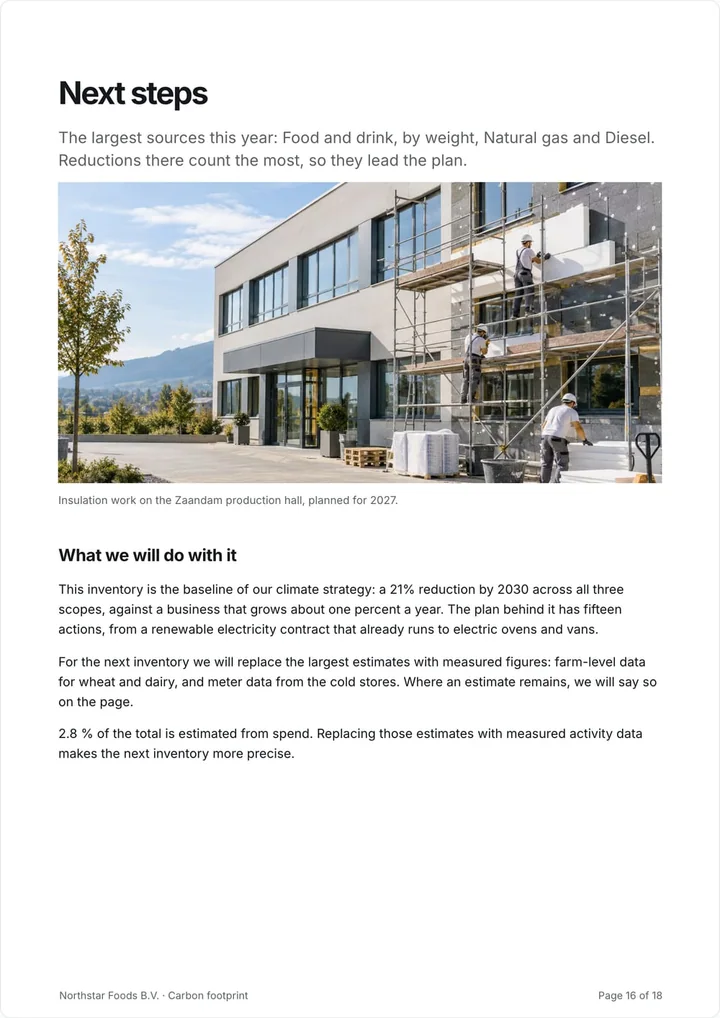
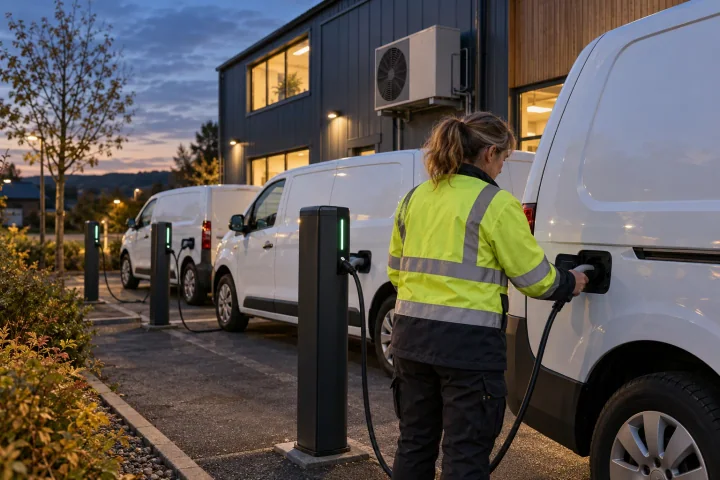
Estimate for each measure how many tonnes of CO₂e it saves per year, what it costs to put in place, what it saves or costs to run, and how hard it is to do. Some measures pay for themselves, such as switching off equipment, fixing leaks or a better electricity contract. Others need investment, such as heat pumps, electric vans or solar panels, and are best timed with the replacement cycle of the equipment they replace.
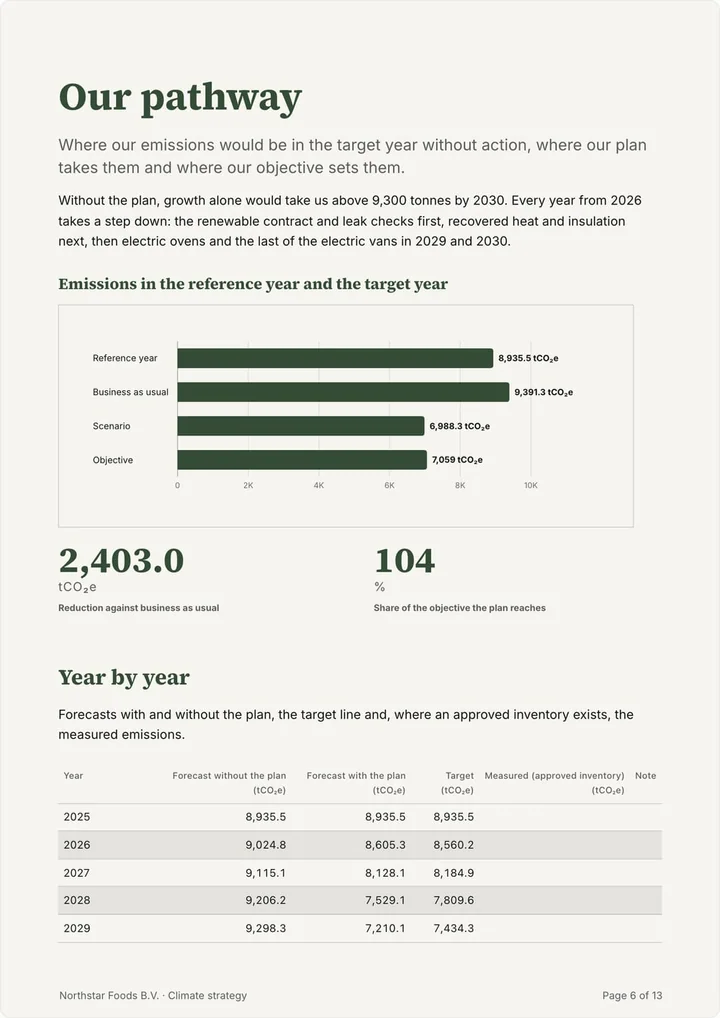
Put the measures on a simple timeline: quick wins in the first year, investments when equipment is due for replacement, and supplier measures as a longer track. Check that the sum of the reductions reaches your target by the target year. If it does not, the plan needs more measures, not a softer target.
Make it a plan people follow
Give every measure an owner, a budget line and a date. Decide how you will measure progress: a lower gas bill, fewer litres of diesel, a supplier’s own footprint. Review the plan once a year with the new footprint, mark what was done and what it delivered, and adjust the rest. A plan that is checked against real figures every year is also what customers, banks and certifiers want to see.
Doing it in Greener Ahead
Carbon accounting in Greener Ahead shows your footprint by source and category, puts the biggest sources first and compares every year with the last, so you can see which measures worked. It costs €1,495 per year with unlimited users, and you can try it free for 14 days without a card. Climate strategy, coming soon, adds targets, an action plan with owners and dates, and a transition plan report on the same footprint. Check the pricing page for current details.
Common measures by emission source
Which measure fits depends on your own figures. The last column is what to track to see whether it worked.
| Source | Typical measures | What to track |
|---|---|---|
| Gas for heating | Insulation, controls and lower set points, heat pump at replacement | Gas use in m³ or kWh per year |
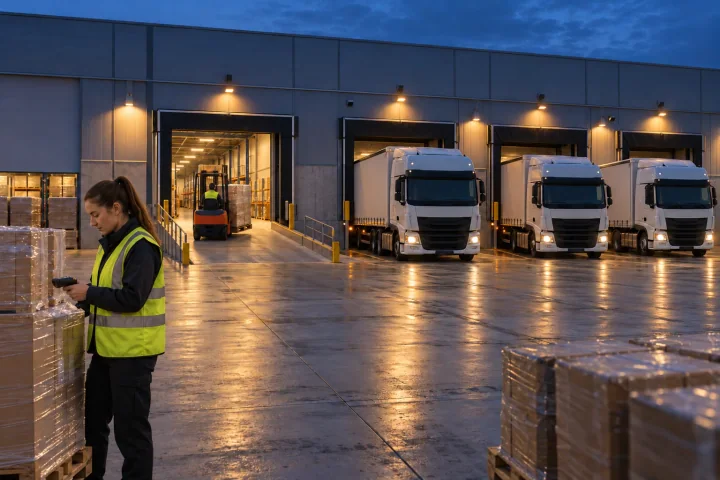
| Company vehicles | Electric vehicles at replacement, route planning, driver training | Litres of fuel and kWh charged |
| Purchased electricity | Efficiency, on-site solar, renewable electricity contract | kWh, and the share with guarantees of origin |
| Refrigerants | Leak checks, repair, lower-impact refrigerant at replacement | Kilograms refilled per year |
| Purchased goods | Supplier engagement, other materials, less waste | Spend or quantity by category, supplier figures |
| Business travel | Rail instead of short flights, fewer trips, online meetings | Kilometres by mode |
| Commuting | Bicycle schemes, public transport, home working | Survey results by mode |
Estimating the reduction of one measure
Use the same sum as your footprint: activity amount times emission factor, before and after the measure.
- Take last year’s activity amount for the source, for example litres of diesel.
- Estimate the new activity amount after the measure, for example the kWh the electric vans will use.
- Multiply both by their emission factors and subtract: that is the yearly reduction.
- Note the assumptions, so next year’s footprint can show whether the estimate was right.
Sources and scope
- GHG Protocol: Corporate Accounting and Reporting Standard
- SBTi: how it works
- GHG Protocol: Corporate Value Chain (Scope 3) Standard
These resources explain a preparation workflow. Check your selected standard and recipient requirements before sharing your report.
 Joost ThissenFounder