A company water footprint shows how much fresh water it uses and where. Withdrawal is all the water a site takes in, discharge what it returns, and consumption the difference. The Water Footprint Network splits a footprint into blue, green and grey water, and ISO 14046 sets out a life-cycle method. The VSME asks for total water withdrawal and water consumption at sites in areas of high water stress, which you can screen with the WRI Aqueduct atlas.
What a water footprint is
A water footprint shows how much fresh water a company or product uses and where. The term comes from the Water Footprint Network, which splits it into three parts: blue water taken from rivers, lakes and groundwater; green water from rainfall used by crops; and grey water, the amount needed to dilute pollution to acceptable levels. ISO 14046 sets out how to assess a water footprint with life-cycle methods. Most companies start smaller, with their own sites.
Withdrawal, consumption and discharge
Withdrawal is all the water a site takes in, from the mains, a well or surface water. Discharge is the water it returns, usually to the sewer. Consumption is the difference: water that evaporates, ends up in products or is otherwise not returned. A brewery or a cooling tower consumes a lot; an office withdraws water but returns most of it.
Where water stress matters
A cubic metre used in a region with plenty of water has a different impact from one used where water is scarce. Reporting standards therefore ask which sites are in areas of high water stress. The free WRI Aqueduct Water Risk Atlas shows baseline water stress for any address, which is enough for a first screening. In Europe, large parts of Spain, southern Italy, Greece and Cyprus are under high or extremely high water stress, and other regions are in dry summers.
What the VSME and other frameworks ask
The basic module of the EU voluntary standard (VSME) asks for total water withdrawal in cubic metres, and water consumption at sites in areas of high water stress, for companies whose processes use significant water. Larger companies under the European Sustainability Reporting Standards report more detail on water and marine resources. CDP runs a separate water security questionnaire that some large customers send to their suppliers.
Collecting the figures
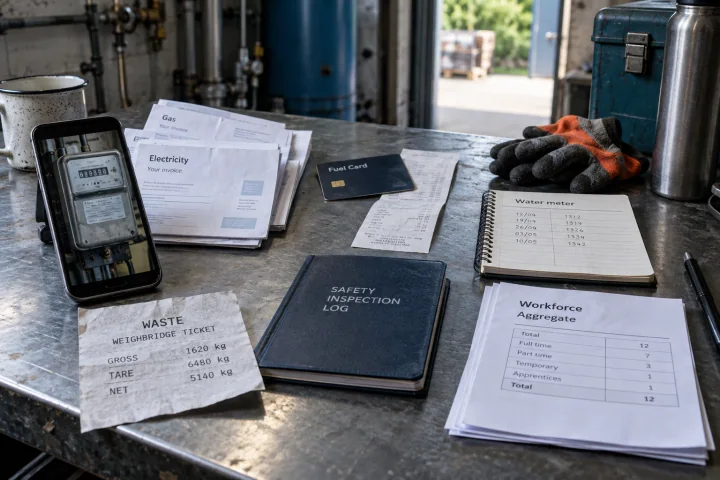
Water bills give withdrawal per site, usually in cubic metres per quarter or year. Your own wells may have meters or permit records. Discharge appears on sewer bills or can be estimated from withdrawal minus what evaporates or goes into products. For offices in shared buildings, ask the landlord for your share. Keep the same method every year and mark estimates as estimates.
Doing it in Greener Ahead
Greener Ahead does not calculate product water footprints. Sustainability reporting in Greener Ahead prepares a VSME report that records water withdrawal per site, flags sites in areas of high water stress and keeps the bill or meter reading behind every figure, next to your energy, emissions and waste data. It costs €995 per year with unlimited users, and you can try it free for 14 days without a card. Check the pricing page for current details.
Water terms at a glance
The terms reporting frameworks use.
| Term | What it means |
|---|---|
| Withdrawal | All water a site takes in from mains, wells or surface water |
| Discharge | Water returned, usually to the sewer or surface water |
| Consumption | Withdrawal minus discharge: evaporated or built into products |
| Blue water | Fresh surface and groundwater used |
| Green water | Rainwater used, mostly by crops |
| Grey water | Water needed to dilute pollution to acceptable levels |
| High water stress | Areas where demand takes a large share of the available water |
Steps to a first water figure
A workable order for the first year.
- List every site and where its water comes from.
- Collect a year of water bills or meter readings per site.
- Look up each site in the Aqueduct Water Risk Atlas.
- Estimate consumption for sites with cooling, irrigation or water in products.
- Record the method so next year’s figure is comparable.
Sources and scope
- Water Footprint Network: what is a water footprint?
- ISO: ISO 14046:2014 Water footprint
- World Resources Institute: Aqueduct Water Risk Atlas
These resources explain a preparation workflow. Check your selected standard and recipient requirements before sharing your report.
 Joost ThissenFounder