ESG KPIs are the figures a company reports on environmental, social and governance topics, each with a definition, unit, period, boundary and source. The EU voluntary standard (VSME) gives a recognised core list: energy use, Scope 1 and 2 emissions, emissions intensity, water, waste, biodiversity, workforce numbers, turnover, accidents, minimum wage, pay gap where required, collective bargaining, training hours, and corruption convictions and fines.
What makes a good ESG KPI
An ESG key performance indicator is a figure that shows how a company performs on an environmental, social or governance topic. To be useful it needs a clear definition, a unit, a period, a boundary that says which sites and entities it covers, and a source document behind it. The same definition has to be used every year, otherwise the trend means nothing. Customers, banks and investors increasingly ask for the same set, so it pays to use a recognised list rather than inventing your own.
Environmental indicators
The basic module of the EU voluntary sustainability reporting standard (VSME) asks for these environmental figures:
- Total energy use in MWh, split into electricity and fuels, and renewable and non-renewable.
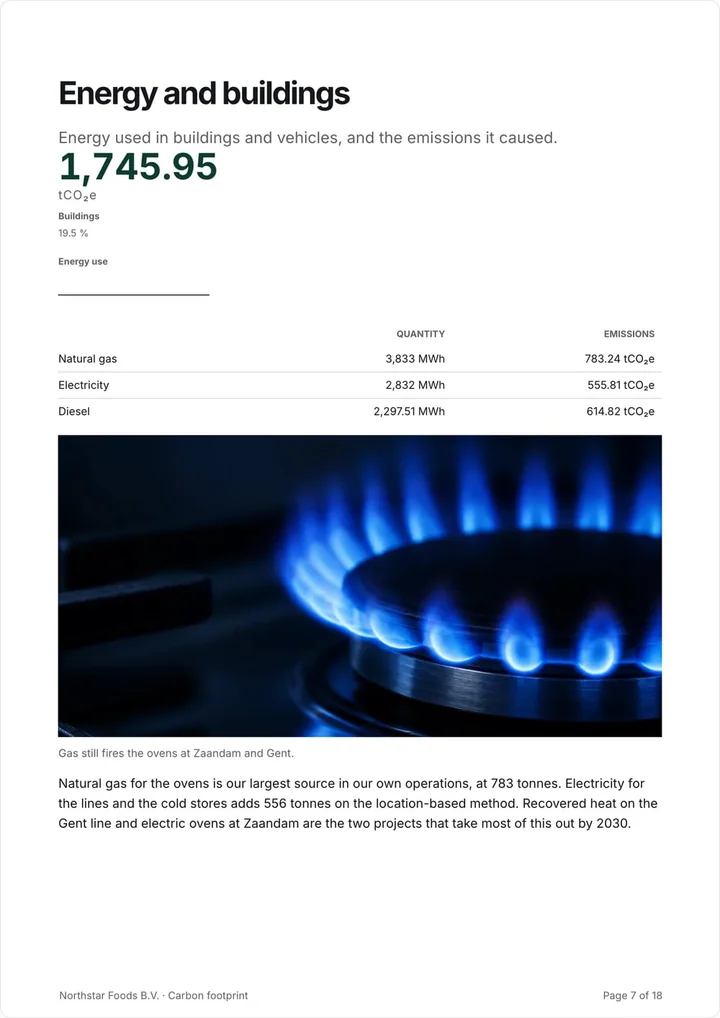
- Scope 1 and Scope 2 greenhouse gas emissions in tonnes of CO₂e, and emissions intensity per euro of turnover. Scope 3 is encouraged.
- Emissions to air, water and soil, where the company already reports them by law or under an environmental management system.
- The number and area of sites in or near biodiversity-sensitive areas, and land use.
- Total water withdrawal in m³, and water consumption at sites in areas of high water stress.
- Total waste in tonnes, split into hazardous and non-hazardous, and the share sent for recycling or reuse. Manufacturers add the mass of their main materials.
Social indicators
For the workforce, the VSME asks for:
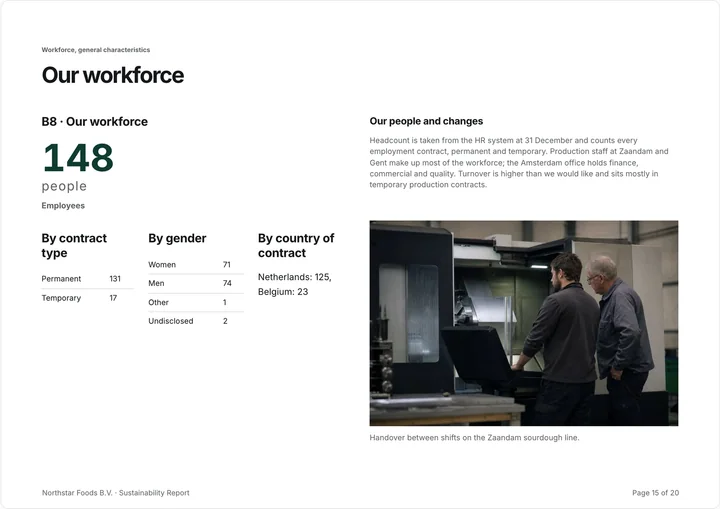
- The number of employees by contract type, gender and country, and the employee turnover rate for companies with 50 or more employees.
- The number and rate of recordable work-related accidents, and the number of fatalities.
- Whether employees earn at least the applicable minimum wage, and the gender pay gap where the law already requires you to report it.
- The share of employees covered by collective bargaining.
- Average training hours per employee, by gender.
Governance indicators
In the basic module, governance is mainly about policies and business conduct: whether the company has policies on its sustainability topics, and the number of convictions and the amount of fines for corruption and bribery. The comprehensive module adds the gender diversity of the governance body, and whether the company has a code of conduct, transition plan and targets. Other frameworks, such as the GRI Standards, have longer lists, but they cover the same core.
Choosing your own set
Start with what you are already asked for: customer questionnaires, the bank, a rating such as EcoVadis. Most of it is in the VSME list. Add the two or three figures that matter most for your business, such as fleet fuel for a transport company or water for a food producer, and define each one once. Fewer indicators with real data beat a long list of estimates.
Doing it in Greener Ahead
Sustainability reporting in Greener Ahead prepares a VSME report with every basic and comprehensive indicator, explains what each one asks and which document it comes from, and keeps last year’s figures next to this year’s. It costs €995 per year with unlimited users. Carbon accounting calculates the energy and emissions figures from your invoices for €1,495 per year. You can try both free for 14 days without a card. Check the pricing page for current details.
Core indicators with unit and source
The VSME basic module indicators most companies can report from their own records.
| Indicator | Unit | Where the data comes from |
|---|---|---|
| Energy use | MWh | Electricity, gas and fuel invoices |
| Scope 1 and 2 emissions | t CO₂e | Energy data and emission factors |
| Emissions intensity | t CO₂e per € million turnover | Emissions and the financial statements |
| Water withdrawal | m³ | Water bills or meter readings |
| Waste | tonnes, hazardous and non-hazardous | Waste contractor statements |
| Employees | headcount by contract, gender, country | HR records |
| Work accidents | number and rate | Accident register |
| Training | hours per employee | Training records |
| Corruption convictions and fines | number and € | Legal and finance records |
Rules for a usable indicator
Apply these to every figure you publish.
- Write the definition down once and use it every year.
- State the period and which sites and entities are included.
- Keep the source document for every figure.
- Show last year’s figure next to this year’s.
- Mark estimates as estimates and say how they were made.
Sources and scope
These resources explain a preparation workflow. Check your selected standard and recipient requirements before sharing your report.
 Joost ThissenFounder