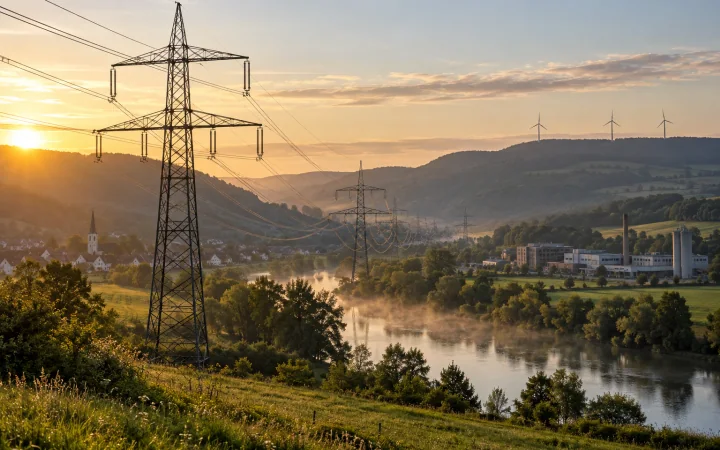
Every location-based Scope 2 figure is a simple multiplication: the kWh you used times the emission factor of the grid you are on. The kWh are yours. The factor depends almost entirely on where you are, and across Europe it differs by a factor of more than fifty.
The European Commission's Joint Research Centre (JRC) publishes national electricity emission factors every year for the Covenant of Mayors. The 2026 edition covers data up to 2024. Here is what it says.
Grams of CO₂e per kWh, by country
| Country | 2024, direct | 2015, direct | 2024, life cycle |
|---|---|---|---|
| Cyprus | 562 | 666 | 713 |
| Poland | 511 | 741 | 585 |
| Czechia | 372 | 528 | 393 |
| Malta | 341 | 655 | 450 |
| Estonia | 339 | 929 | 524 |
| Germany | 302 | 457 | 355 |
| Bulgaria | 268 | 493 | 294 |
| Greece | 267 | 588 | 348 |
| Ireland | 227 | 414 | 303 |
| Netherlands | 218 | 486 | 281 |
| Italy | 216 | 337 | 305 |
| Romania | 213 | 332 | 248 |
| Slovenia | 176 | 250 | 193 |
| Belgium | 140 | 227 | 172 |
| Hungary | 132 | 315 | 172 |
| Croatia | 115 | 235 | 155 |
| Spain | 111 | 295 | 159 |
| Austria | 87 | 151 | 111 |
| Slovakia | 70 | 160 | 88 |
| Portugal | 69 | 346 | 111 |
| Latvia | 59 | 142 | 88 |
| Lithuania | 46 | 149 | 84 |
| Denmark | 40 | 151 | 75 |
| France | 31 | 56 | 44 |
| Finland | 28 | 110 | 43 |
| Luxembourg | 22 | 137 | 43 |
| Sweden | 9 | 11 | 22 |
| Norway | 5 | 10 | 13 |
"Direct" counts the CO₂, methane and nitrous oxide from burning fuel in power stations, following the IPCC method. That is the number for location-based Scope 2. "Life cycle" adds the emissions further up the supply chain, such as extracting, processing and transporting the fuel. If you report fuel- and energy-related activities in Scope 3, the difference between the two columns is roughly the upstream part of it.
What the spread means for a real company
Take an office that uses 100,000 kWh a year. In Poland its location-based Scope 2 is 51 tonnes CO₂e. In Germany it is 30 tonnes, in Spain 11 and in France 3. Nothing about the office is different. For companies with sites in several countries, the grid factor is often the single biggest driver of where their Scope 2 sits, which is why a footprint should always show kWh per site next to the tonnes.
Almost every grid got cleaner
Between 2015 and 2024 the factor fell in every country in the table. Portugal fell by 80%, Finland by 74%, Denmark by 73% and Spain by 63%, mostly from wind and solar replacing coal and gas. Estonia had the most carbon-intensive grid in the table in 2015, at 929 grams; by 2024 it was down to 339 as it burned far less oil shale. Poland is down 31% and still has the second highest factor in the EU, because coal remains its largest source.
For your reporting, that trend has one practical consequence: a factor from an old edition is not a harmless approximation. Using the 2015 Spanish factor for 2024 electricity would more than double the result.
Four things to get right
- Use the year you report. Match the factor's data year to your reporting year as closely as the source allows, and record the edition. Factors are published with a lag; the 2026 edition stops at 2024.
- Know what the factor covers. These are national generation averages. Some national sources publish consumption factors that include imports and grid losses, and the numbers differ. Pick one approach and keep it.
- Location-based is not the whole story. If you buy electricity with guarantees of origin or a supplier-specific mix, report market-based Scope 2 as well, and label both.
- Do not mix sources across sites without saying so. A national source for one country and a European one for another is defensible, but write it down.
Greener Ahead uses these JRC factors for location-based electricity in European countries in carbon accounting, and shows the source and edition next to every line. For the method behind it, see our guides to location-based and market-based Scope 2 and emission factors.
 Joost Thissen